


")


CMT’s Tyler Wood joins Andrew Wilkinson to look at both the stock market and the market for stocks in 2023 and has wise words for 2024.
Summary
The following is a summary of a live audio recording and may contain errors in spelling or grammar. Although IBKR has edited for clarity no material changes have been made.
Andrew Wilkinson
Welcome everybody to this week’s podcast. My name is Andrew Wilkinson, and I thought it would be a good way to end the year and look forward to 2024 by reviewing some charts with my favorite technical analyst, Tyler Wood. Welcome back, Tyler.
Tyler Wood
Thanks, Andrew. Good to see you.
Andrew Wilkinson
It’s good to see you mate. Tyler’s back from the Chartered Market Technicians Association or the CMT. And I think last time we did a podcast in July, Tyler, we called it.. I stole a line from what you said, which is, I have some good news, explained the technical analyst. And things kind of looked up from there. So how do you see the world at this point?
Tyler Wood
You know, it’s funny. I delivered that quote, saying the good news was we don’t have to predict the future. Technical analysis allows us to stay on the right side of trends no matter what way they are headed. And yes, we certainly have seen a healthy rally in 2023, very fair and orderly seasonal weakness in October and November. I think there was a bit more of a sentiment washout than what I was expecing. But here we are- December 12th rallying above the July highs and and making a run at all-time highs from 2021.
Andrew Wilkinson
OK, so Tyler’s given me a series of charts and I’m going to include them in the show notes. You’ll see those at ibkrpodcasts.com in the episode show notes. So, take a look at those to kind of view along.
Let’s start then I think Tyler. With the SPX, the S&P 500. What are you seeing there?
Tyler Wood
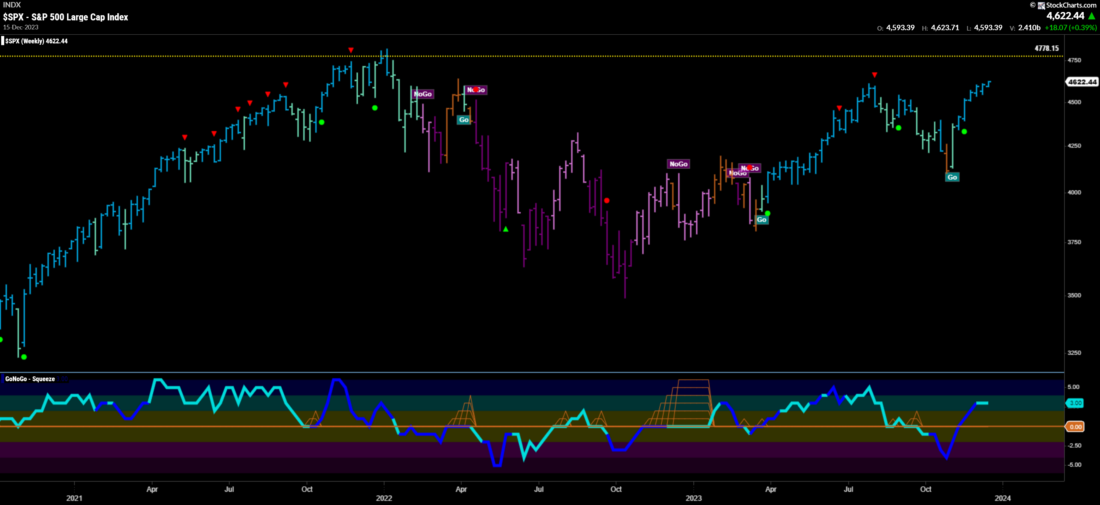
The thing that most people forget is that markets can move in three directions, right? We love a binary black and white world where it’s either going up or it’s going down. But when you look at three years of market history on the S&P 500, we rallied through 2021 and that felt like a great bull market. 2022 was really quite fair and orderly retracement of a lot of those gains as we saw interest rates peak and we’ll get to that in a minute.
Past performance is not indicative of future results
Where we’re at right now is a little bit of a confusing point. Certainly there is a strong equity rally and it’s been led by the mega cap tech names. Growth stocks have been our leadership groups throughout this rally. And when I’m looking at us reclaiming those highs from from July and maybe making a run at all-time highs to reclaim where we reached in in 2020, that’s all fine and well. I certainly root for the US economy and root for the market, and I think maybe we’re a little over our skis in terms of the market pricing in this expected soft landing from the Fed.
But when I look at a chart like this, it doesn’t scare me that potentially we hit some resistance back at the 47-50 level and tank, right? There are plenty of talking heads on financial news media predicting the end times to come in 2024 and they may be right. They’re very smart people. They’re looking at a lot of data sets and I think a lot of the macro investors have been very resistant to this year’s equity rally.
Firstly, they point to breadth. And then they also point to the fact that the macro landscape and the lagging effect of these higher sustained rates from the Fed could really pose a drawdown on the economy that we haven’t seen yet. So, case in point, right, people talk about most mortgages in the US locked in for 30 years at low rates. How about our Canadian counterparts? They have to refinance every five years Or what about the folks that need to buy a new car and what are those loans going to cost in terms of how that pinches the cash flow in the economy? We may not have seen the full effect of these fed rate hikes yet, which is why they paused quite a while ago, and we’ve just been sustaining higher for longer. When people look at those historical corollaries, when the Fed has paused rate hikes, we’ve often seen market retracements and severe activity after the fact, right? It could be a three to six month lag.
Andrew Wilkinson
So, now, the next chart we wanted to look at is the Value Line Geometric, which I’m going to ask you to explain for the listener and for my benefit. What is the Value Line Geometric chart all about?
Tyler Wood
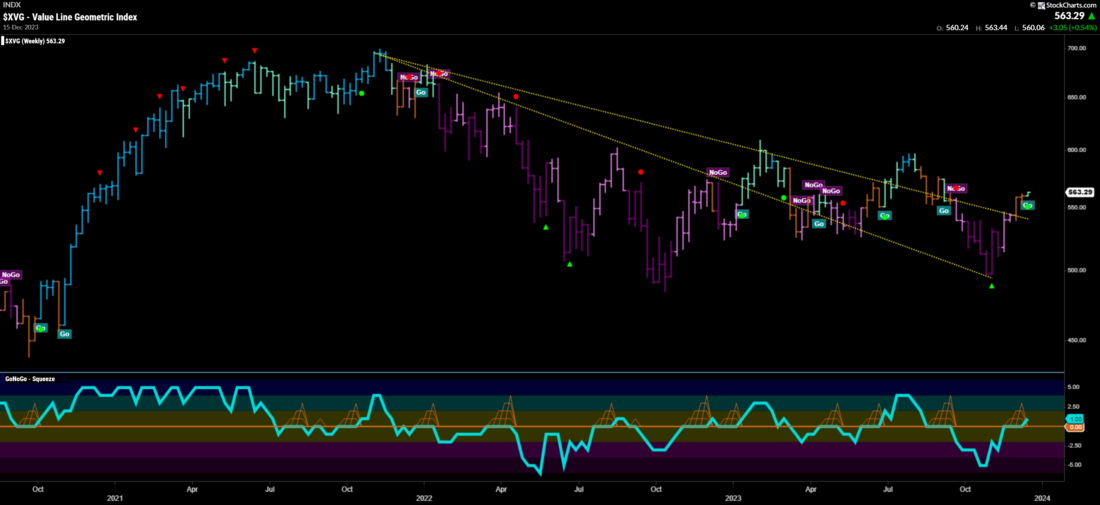
Yeah. So people talk about the stock market, but it’s not a stock market or just the index. It is a market of stocks and in the average stock in the United States, we haven’t seen a strong rally. Meaning here in 2023, as the index climbed higher, the average performance has really been quite a choppy range bound mess. And you’ll see it in that chart. From our trend models it’s reentered an upward trending environment in the weak form. This is on a weekly basis, but we’re seeing a break back to positive momentum. We’re seeing it reenter a positive trend on this Value Line Geometric Index.
Past performance is not indicative of future results
And like the RSP or any other vehicle you might look at to see an equally weighted performance of the average stoc, this is another way of looking at that. And the point that I think I would want to make to all the listeners is that, absolutely the equity index, it’s nice to see that reclaiming prior highs or maybe even making a run at a breakout. But as investors, we have tons of opportunity under the hood and all the critics of this bull market saying that, you know, there’s no breadth expansion, it’s just these Magnificent 7 that are that are carrying us higher. You know, this week we saw semiconductors breaking out to all-time highs. We saw small cap industrials breaking out to all-time highs. There’s a lot happening under the hood, which doesn’t necessarily equate to a new breakout in all-time highs at the index level.
So the point that I want to make is- as everybody starts to think about what’s the game plan for next year? Everyone’s trying to predict the future about what’s going to happen with the Fed and how markets will react. What I would say is the good news is you don’t have to predict a scenario for the index and it may be another lost decade. Who knows, right? We could chop around at the index level for 10 years. But seeing the Russell 2000 moving higher, seeing these breakouts in some small cap names, seeing the rotation of the marketplace into new sectors and new industry groups, I think is really exciting because you could have a stealth bull market right in the average stock. Maybe the index doesn’t pull out higher and that’s maybe bad news for the passive buy and hold closet indexers. But for those of us who are investing in individual securities or being a little more tactical in terms of where we put capital to work, I think there’s a lot of good news happening under the hood.
And so that that Value Line Geometrix Index, it’s not in a raging uptrend but you’ll see that we’ve broken back above some downward sloping trend line and for the third time we’ve reentered trending conditions based on our model. And I just see some good news on the horizon for expanding breadth and the rotation in the market, which the great Ralph Acampora said.
“Rotation is the lifeblood of bull markets.”
Andrew Wilkinson
Now, Tyler, we’ve got to back up here a little bit. We’re going to talk about the Ten-Year Treasury Yield. It’s been a big year for monetary policy. The Fed seems to have stopped tightening back on November the 1st. How does the Ten-Year yield look chart wise?
Tyler Wood
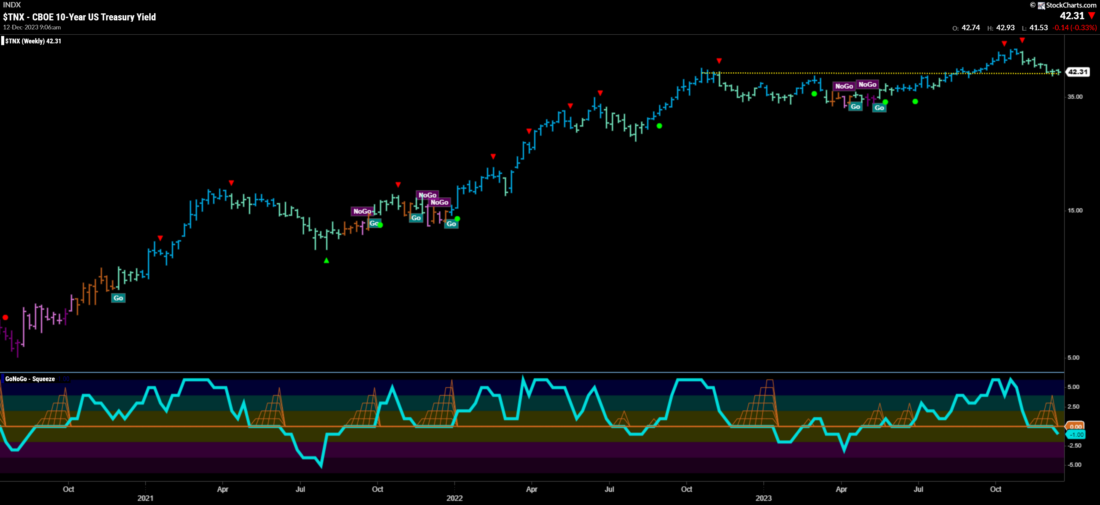
We’re still a series of higher highs and higher lows. The pace of rate incases I think was what shocked the market. The uncertainty in 2022 of just how fast and how far, nobody quite knew what the upside target was. And some very prominent technical analysts were calling for 5% well before the rest of the public even thought that was possible.
Past performance is not indicative of future results
When I think about Ten-Year Treasury yields, I like to look at a quarterly chart. It goes back to about the time that I was born and my parents bought their first mortgage in 81 and you know, they were paying 17% on that. So we have been in a structural downtrend for 40 years or 39.5 years. And what started as just a reversion to the mean back to that downward sloping trend line off the COVID lows in 2020, we’ve broken higher and we’ve sustained that upward trend.
So when I look at this on a weekly basis, we’re coming back to test support at around you know the 4.2 level. We’re seeing momentum strike a little negativity and maybe it’s a pause here which is very healthy. That’s a tailwind for risk assets and for equities, but I certainly wouldn’t be in the camp that would predict a return to 0 interest rates or negative interest rates that they saw in Europe. I don’t think we’re going back there and I’m not alone in that opinion. I think you’ve probably heard that from every one of your guests.
Andrew Wilkinson
Let me ask you a question about that.
Tyler Wood
Yeah please!
Andrew Wilkinson
Amidst all the panic, when yields hit 5%, was that kind of a.. did you feel a bit of relief at that point? Do you think this is going to create change for the market trend?
Tyler Wood
Create change for the average household, big time. And not positive change, right? We’re fighting inflation and we’re also constricting capital flows. So for the average household that’s not good news, but it doesn’t have to be the end times for all investors.
If you look back at the 1950s and I don’t put a ton of weight in in historical corollaries, but you can have a bull market in a rising rate environment. There’s more volatility. Maybe you need to think about shortening up your time frames for what you’re holding, but a rising rate environment is inherently bullish for the economy. And I think the fear that we’ve spiked in rates or the expectation that they would be back at, you know 1% by the end of the year, that’s maybe shortsighted. I don’t see a Fed cutting cycle that’s going to begin or begin so aggressively in the early part of next year.
Andrew Wilkinson
Yeah, our economist Jose Torres has been talking referring to this period between the end of tightening and the start of cutting as a monetary policy bridge. And he’s got many things to say about that. You’re on the bridge fishing with us right now, Tyler!
Tyler Wood
Yeah, we’re going to hear from Chairman Powell tomorrow on the 13th and we’ll probably get the same kind of narrative that we’ve heard, which is we’re sticking with these higher rates while we continue to fight towards our inflation target. Core numbers versus headline numbers are what everybody wants to talk about. And for me, as an investor, it’s important to understand the relationship between these assets. The intermarket analysis that John Murphy taught us back in the day is still really important. Very valid today. But I certainly don’t want to spend too much time trying to predict what the Fed’s going to do. I’ll just react to what comes my way.
Andrew Wilkinson
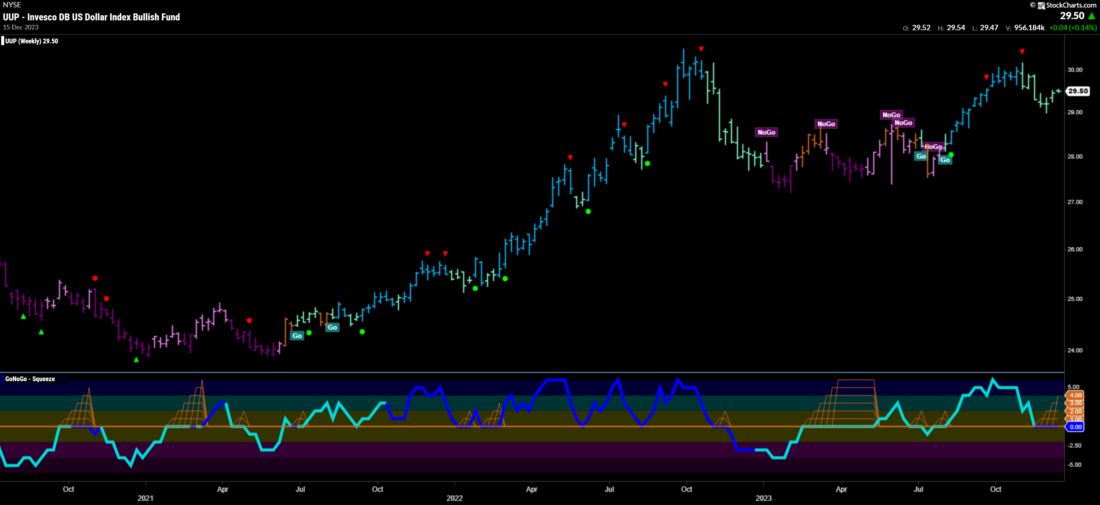
Now 2023, being a good year for the dollar based upon that prior conversation about rising interest rates, rising yields were pretty much on that monetary policy bridge. What’s the implication for the dollar index on the chart?
Tyler Wood
The dollar index is a really important corollary to what happens with risk assets. And so, when we can get a break in that dollar strength, it’s been a good time for equity rallies. And they tend to be very strongly anti-correlated.
Past performance is not indicative of future results
What we’ve seen from 2021, over the last three years is this incredible strength in the US dollar and I’m going to lean on my macroeconomist friends to help explain. We’re probably the cleanest shirt in the dirty laundry pile, right? Which is the phrase that everyone uses. I don’t see a currency war coming along. I don’t see China just dumping all of its U.S. debt holdings.
What I think what I think happens from here is that we’re stabilizing, right? So we peaked out in September of 22’. We started to see some relief on that dollar strength basing out through most of 2023, chopping around, which is really good for markets, right? It doesn’t actually matter so much where the level is, but when you have currency stability, I think that relieves some of the uncertainty for investors.
We had a little rally through the Fall that correlated with the seasonal weakness in equity markets. And right now, we’re turning back up again, but we’re at fairly neutral momentum. We’re kind of chopping around. At this 103, 102 level and that’s not a bad spot for us to be.
Andrew Wilkinson
Heading into year end, I’ve heard the expression, the “Everything Rally” and one of the one of the ingredients there in that rally has been gold, which has perked up this year, again, courtesy of inflation. What’s gold looking like chart-wise?
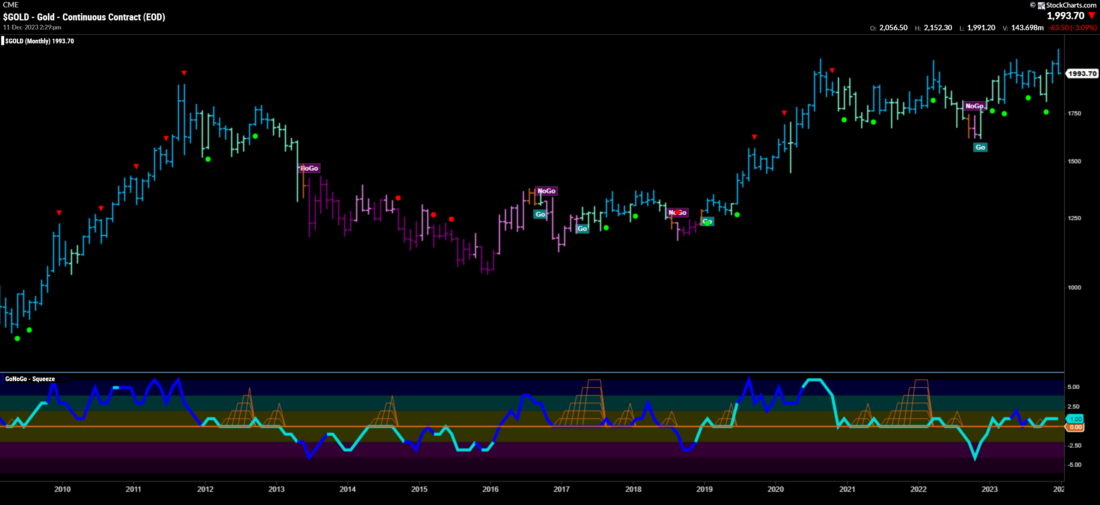
Tyler Wood
I pulled this out on a monthly chart. I’m not the only person looking at this right, but we have a decades-long basing pattern, from the highs in 2011 back to the rally in gold in 2020. And that huge smiley face that you see on your screen is what Louise Yamada and Ralph Acampora and Alan Shaw… like we want to buy smiley faces. You know, when they break out of a basing pattern that’s a decade long that could be really, really bullish.
Past performance is not indicative of future results
Now for four years, we have been retesting that $2100/ounce sort of level. For gold, we cannot break through it. We rallied through the end of last week, had kind of a blow off top and we’ve corrected sharply this week.
Here’s what I would say as an investor. Every one of my econ textbooks in grad school said, yeah, gold is the flight to safety. That’s the place you go in an inflationary environment to have a store of value. Well, there are alternatives in 2023 for people looking for a store of value that’s perhaps not so impacted by inflation. And I think that that may be one of the things that is putting this really heavy ceiling on gold breaking out above $2100.
If it does, right, and here’s the scenario playing that I am comfortable with. We know that breaking above $2100 at all-time highs above this resistance level we’ve tested now five times, going back to 2011, that’s a sizable move.
The investor psychology around gold, if we’re breaking out to all-time highs above this resistance level that has been so heavy on gold, then I think there’s a real interest from a lot of investors to being long gold and that’s just going to drive demand, which is going to drive price up.
So do we continue to chop around and retest that level a few times potentially? Andrew, I have a young daughter who practices Taekwondo and sometimes she has to do board breaking. And I’m not going to lie, sometimes she takes three, four, five whacks at that board before she can get through it. What we know about resistance levels is the more times they are tested, the more likely it is that they break through eventually.
Andrew Wilkinson
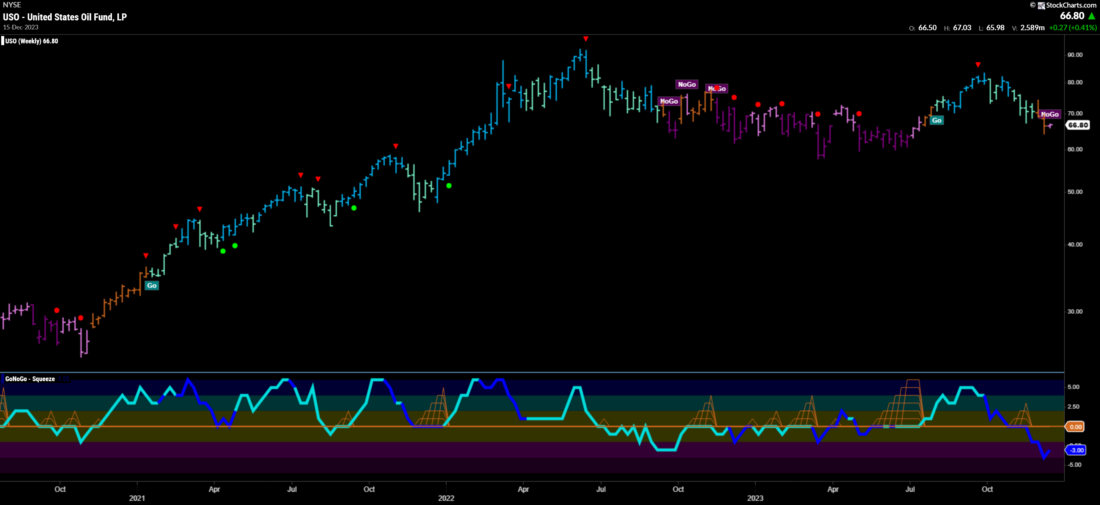
Now the final chart. This is a really good way to wrap up today’s conversation. Oil. Crude oil and its significant implications. It’s had a great bull market of its own, the fundamentals have lined up behind it and then it’s.. the economy is ripped and the Fed is trying to contain it.
People seem to be looking at commodities thinking that just perhaps if there is a soft landing or, heaven forbid, a hard landing, then crude oil is going to suffer. So we’re back to somewhere around the $70.00 mark on crude oil. How does that chart play out?
Tyler Wood
So for us, looking at the trend model, we rallied a bit through the Fall. We’re back into no-go conditions or down trends. We’ve got negative momentum. For me that’s a bullish sign for the economy, for the fight against inflation. We don’t want to see oil back above $200/barrel. That’s a huge drag on a lot of small business owners and a lot of the industrial economy. But what I really like seeing through 2022 and 2023 was this stabilization, right?
Past performance is not indicative of future results
Oil was negative. What a crazy time we live in, Andrew. Negative pricing on barrels of oil in the depths of the pandemic. That’s a logical low for what was a multi decade or a decade long downtrend in crude. Could that have been the low and we pop off of that into what could be a commodity super cycle or a super-duper cycle or whatever silly name you want to put on it?
What commodities trends tend to look like is longer term we see the dominance, right? Stocks over rocks or rocks over stocks. And I think if we are going to see a bull market across commodities, oil is definitely going to be participating. I think timeframe really matters.
So if we’re talking about what does this look like in 2030, that’s a very different conversation to do I want to be invested in oil right now? And the answer is no.
Right now it’s in a downtrend, there’s negative momentum. Crude is pulling back and that could be bullish for the economy, for small business owners and for industrials. But do I think crude is going back to zero? Absolutely not. And certainly it looks structurally like we’ve set some new highs, we’ve failed to reclaim those and break out again. But I would venture to guess that over the next few years we’ll continue to see commodities start to perform well against other asset classes.
Andrew Wilkinson
What’s the feeling amongst the professional crowd of CMT Charter holders, those who work for investment banks and broker dealers and so on? What are your guys telling you, what’s the feedback and the outlook for next year? What do they think?
Tyler Wood
You know, it’s fairly well split, which is what makes a good market, right? If everybody’s on one side of the boat, it tends to tip over. And so, depending on your time frame and the tools that you’re using, you could come up with evidence for either scenario. But I think technical analysts as a whole would agree that where the index heads is not the most important thing. It’s getting your sector bets right, making sure you can be tactical.
If we’re in a higher volatility regime with rates being higher, maybe we shorten up our time periods a little bit. Maybe investors instead of holding for multi-year periods start to look at things rotating every six to nine months and paying closer attention to what those leadership groups are. We’ve certainly seen the rotation cycles speed up and I think part of that has to do with the frictionless way in which people trade through ETFs and other vehicles. We’ve certainly seen explosive activity in the options market, which certainly changes the tenor of market trading as well.
Andrew Wilkinson
You mentioned small CAP stocks earlier on. Why would they be breaking up now?
Tyler Wood
So when you talk about the “Everything Rally” right, when we look at rotation and we start to see value performing better in a higher rate environment, I’m going to use the F word here for a second, Andrew.
Andrew Wilkinson
Uh oh!
Tyler Wood
The fundamentals of the companies, those small cap and value names start to look more attractive as people digest the fact that we might have higher rates for much longer. So, the long duration growth equities that have held our market up this year, maybe potentially don’t look as good under that backdrop of a Fed that’s not willing to start cutting. And I think commentary from Chairman Powell tomorrow will be important, but also what they act on in the first quarter if they are sustaining these levels, then we could see investors really start to shift their holdings and start to allocate, you know, watch those money flows.
If they are piling into those small caps, we could certainly see a massive rally under the hood that wouldn’t really impact the index level and I’m certainly rooting for an “Everything Rally”. I think it’s about time to have that breadth expansion and see some new leadership emerge.
Andrew Wilkinson
Excellent, Tyler. Brilliant. Thank you very much.
One final, final question, what’s the outlook for the CMT from here? You mentioned Dubai to me earlier- what’s happening?
Tyler Wood
I’m so glad you asked. Speaking of crude oil downtrends, the Gulf region is an incredible financial powerhouse. Dubai is one of the freest cities in the world. We opened an office in India in 2018 and there is an inextricable link between the vast and fast growing Indian economy and the financial center in Dubai. We have members all over the world and instead of hosting our large flagship event in New York each year, here in 2024, we are moving that to Dubai. So mark your calendars for Leap Year 2024. We’re going to be hosting February 28th and 29th at the Crown Princes Museum of the Future in Dubai. A wonderful seminar with some of the world’s top money managers, trend followers, global macro analysts. We’re really excited about what we’re able to pull together and you know, Dubai is sort of the the crossroads of the globe. Everybody can get there with a pretty easy flight. So, looking forward to that and hopefully some of our Interactive Brokers friends will come join us.
Andrew Wilkinson
Very good. I certainly hope so.
Tyler Wood, CMT of the Chartered Market Technical Analyst Association. Thank you very much for joining me.
Tyler Wood
Thank you so much, Andrew. Happy holidays to everyone sending love and light talk to you soon.
Andrew Wilkinson
Thanks, Tyler. Bye for now.
Disclosure: Interactive Brokers
Information posted on IBKR Campus that is provided by third-parties does NOT constitute a recommendation that you should contract for the services of that third party. Third-party participants who contribute to IBKR Campus are independent of Interactive Brokers and Interactive Brokers does not make any representations or warranties concerning the services offered, their past or future performance, or the accuracy of the information provided by the third party. Past performance is no guarantee of future results.
This material is from GoNoGo Charts and is being posted with its permission. The views expressed in this material are solely those of the author and/or GoNoGo Charts and Interactive Brokers is not endorsing or recommending any investment or trading discussed in the material. This material is not and should not be construed as an offer to buy or sell any security. It should not be construed as research or investment advice or a recommendation to buy, sell or hold any security or commodity. This material does not and is not intended to take into account the particular financial conditions, investment objectives or requirements of individual customers. Before acting on this material, you should consider whether it is suitable for your particular circumstances and, as necessary, seek professional advice.
Disclosure: ETFs
Any discussion or mention of an ETF is not to be construed as recommendation, promotion or solicitation. All investors should review and consider associated investment risks, charges and expenses of the investment company or fund prior to investing. Before acting on this material, you should consider whether it is suitable for your particular circumstances and, as necessary, seek professional advice.
Disclosure: Options Trading
Options involve risk and are not suitable for all investors. For information on the uses and risks of options read the "Characteristics and Risks of Standardized Options" also known as the options disclosure document (ODD). Multiple leg strategies, including spreads, will incur multiple transaction costs.
Disclosure: Futures Trading
Futures are not suitable for all investors. The amount you may lose may be greater than your initial investment. Before trading futures, please read the CFTC Risk Disclosure. A copy and additional information are available at the Warnings and Disclosures section of your local Interactive Brokers website.
Disclosure: Bonds
As with all investments, your capital is at risk.
Disclosure: Forex
There is a substantial risk of loss in foreign exchange trading. The settlement date of foreign exchange trades can vary due to time zone differences and bank holidays. When trading across foreign exchange markets, this may necessitate borrowing funds to settle foreign exchange trades. The interest rate on borrowed funds must be considered when computing the cost of trades across multiple markets.