


Originally Posted, 18 March 2024 – Historic concentration forges emerging asset class in US growth equities
ClearBridge Investments: Mega cap concentration and size limits for smaller cap indexes has created a wide gap to emerge between large cap and mid cap growth asset classes.
Contributors: Evan Bauman, CFA; Aram Green, CFA; Amanda Leithe, CFA
Key takeaways
- The market for growth stocks defined by indexes and followed by most active strategies has morphed from a diverse, all cap universe to one increasingly concentrated in a handful of mega cap stocks. This shift has increased the average market cap while reducing the active share and diversification of most portfolios.
- The combination of mega cap concentration and capitalization limits for small and mid cap indexes has caused a wide gap to emerge between large cap and traditional mid cap growth asset classes.
- Such disparity has led to a cohort of high-quality growth companies from the upper end of mid cap to the lower end of large cap being less well represented in investor allocations. Characterized by stocks in the $10 billion to $100 billion capitalization range, we believe this “mid cap plus” segment merits inclusion.
Growth market has become increasingly concentrated
Over the past few years, a small number of mega cap stocks have experienced a heroic rise in market value. The outperformance of the group, termed the “Magnificent Seven,” which includes Alphabet, Amazon, Apple, Meta, Microsoft, Nvidia and Tesla, has caused a dramatic change in the composition of major indexes. Broad-based market indexes like the S&P 500 Index and even more so growth benchmarks like the Russell 1000 Growth Index and Russell 3000 Growth Index have become increasingly concentrated due to their market-cap-weighted methodology (Exhibit 1).
Exhibit 1: Market Indexes Have Grown Top Heavy
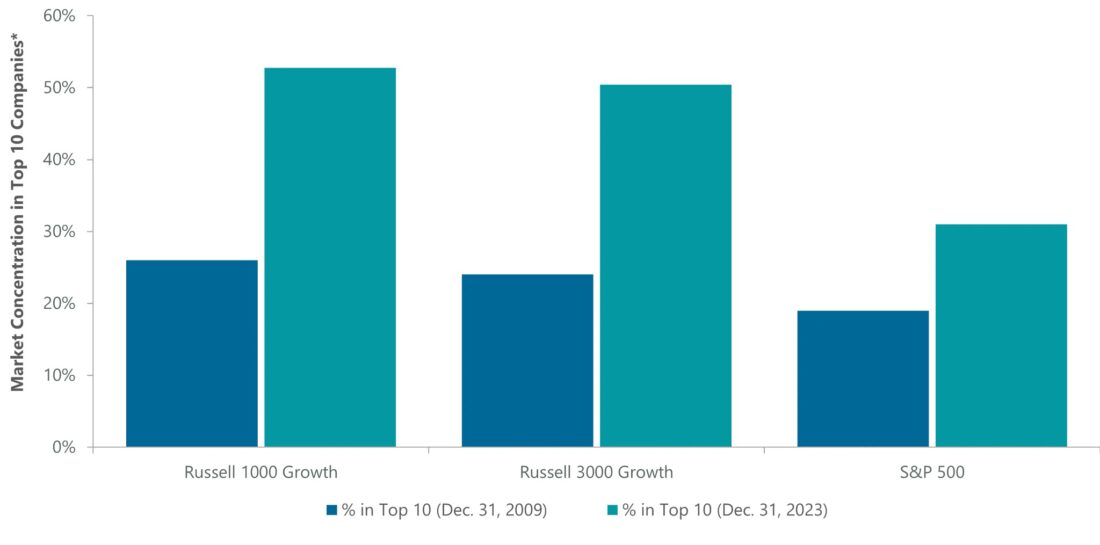
Source: FactSet. *Top 10 companies includes calculation of both Alphabet A & C share classes as one entity. – Past performance is not indicative of future results
The top 10 names in the Russell 3000 Growth Index represented more than 50% of the index at the end of 2023, up considerably from 15 years ago and even compared to the dot-com bubble (Exhibit 2). The market for growth, as represented by these growth indexes, has morphed from what used to be a diverse, all cap universe of stocks to one increasingly concentrated in a handful of mega cap stocks residing in just a few industries.
Exhibit 2: Russell 3000 Growth Concentration in Top 10 at Historic Highs
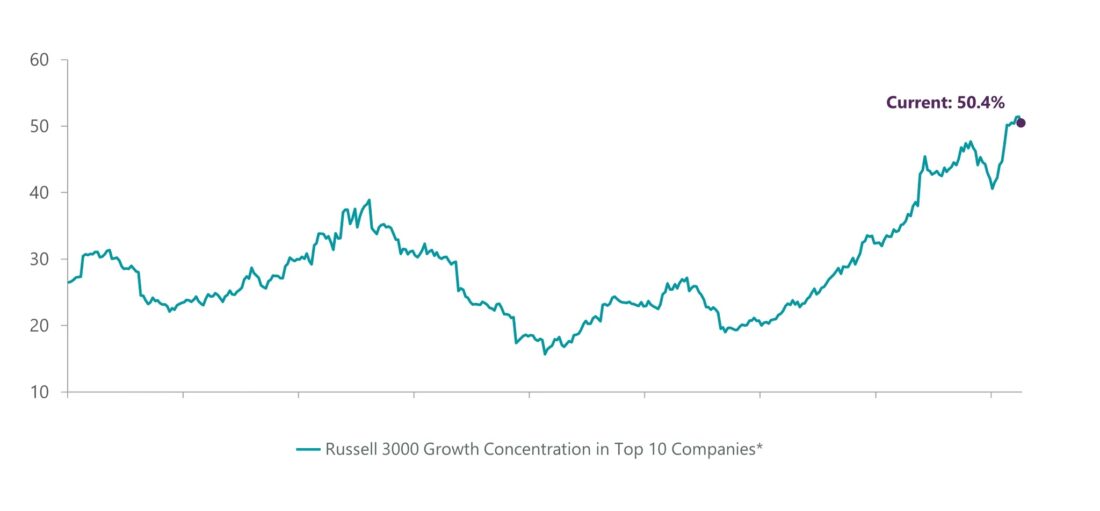
Source: FactSet. *Top 10 companies includes calculation of both Alphabet A & C share classes as one entity. – Past performance is not indicative of future results
Likewise, most all cap and large cap strategies have chased the Magnificent Seven. Cap-weighted passive strategies are required to track concentrated benchmark weightings while most active managers have become closet indexers to keep up from a relative performance standpoint. This has resulted in a peer group that looks increasingly top heavy. Looking across the Morningstar category for large growth, the average exposure of our peer group to these seven names was roughly 31% at the end of 2023, up from 15% just five years ago. Concentration has risen in lockstep, with top 10 names now representing 46% of large growth portfolios, on average, versus 29% five years ago.
With many managers crowding into the Magnificent Seven, we have also seen active share fall across active management. While this is true for core managers, who have shown less active share as compared to the S&P 500 in recent years (Exhibit 3), it is even more pronounced in the market for growth, as evidenced by active share of growth managers versus the Russell 3000 Growth Index.
Exhibit 3: Large Cap Growth Active Share on the Decline
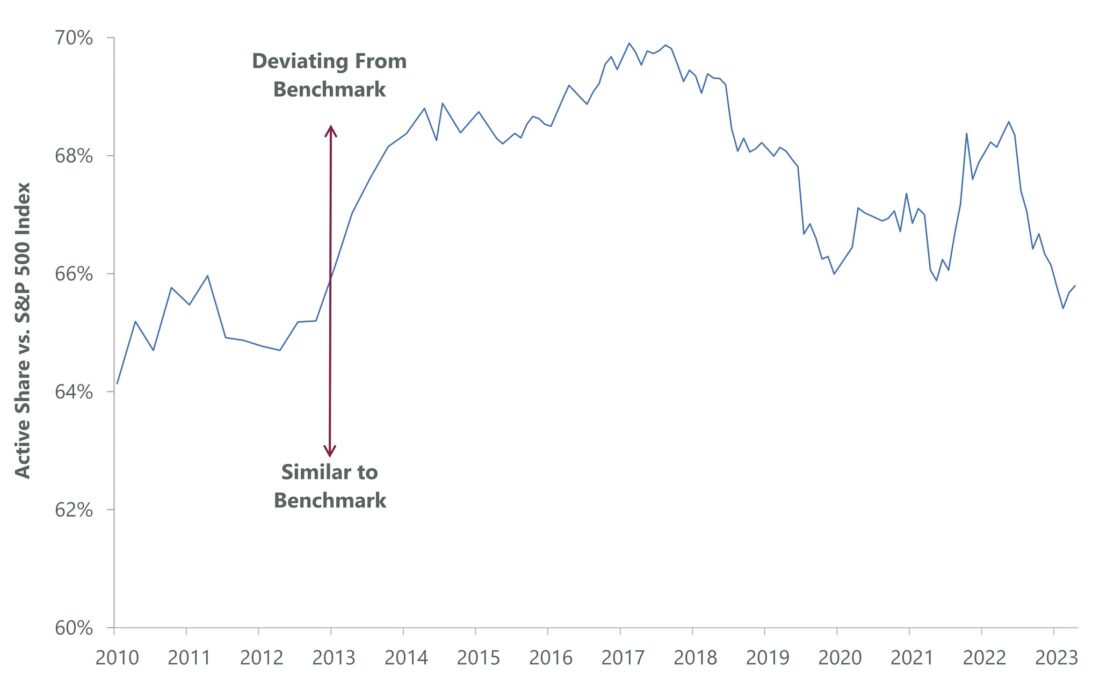
Sources: Bank of America Global Research, FactSet, Securities. As of December 31, 2023. Reprinted by permission. Copyright © 2024 Bank of America Corporation (“BAC”). The use of the above in no way implies that BAC or any of its affiliates endorses the views or interpretation or the use of such information or acts as any endorsement of the use of such information. The information is provided “as is” and none of BAC or any of its affiliates warrants the accuracy or completeness of the information. Past performance is not indicative of future results
The rise in passive assets under management only exacerbates this issue for clients. According to the Investment Company Institute, passive assets now make up 58% of industry assets (Exhibit 4), up significantly from 32% just 10 years ago. With increased allocation to passive vehicles, whether it be the Russell growth indexes or the S&P 500, all now have outsized exposure to a small handful of names. As a result, we believe investors are less diversified than ever.
Exhibit 4: Majority of Assets Reside in Passive Strategies

Source: Strategas, based on an analysis of data from the Investment Company Institute. Assets represent US equities only. As of December 31, 2023. Past performance is not indicative of future results
A vacuum between large and mid cap growth
Increased exposure to mega cap stocks across both passive and active strategies has resulted in a market (as defined by major indexes), as well as all cap growth and large cap growth peer sets, with significantly higher weighted average market caps than we have seen historically. The weighted average market cap of the Russell 3000 Growth is up more than 13x since 2009 as index concentration has become more extreme. Likewise, as illustrated well by Morningstar’s traditional style map (Exhibit 5), most large cap growth peers now extend beyond the large growth style box.
Exhibit 5: Large Cap Growth Strategies Have Grown Beyond Their Style Box
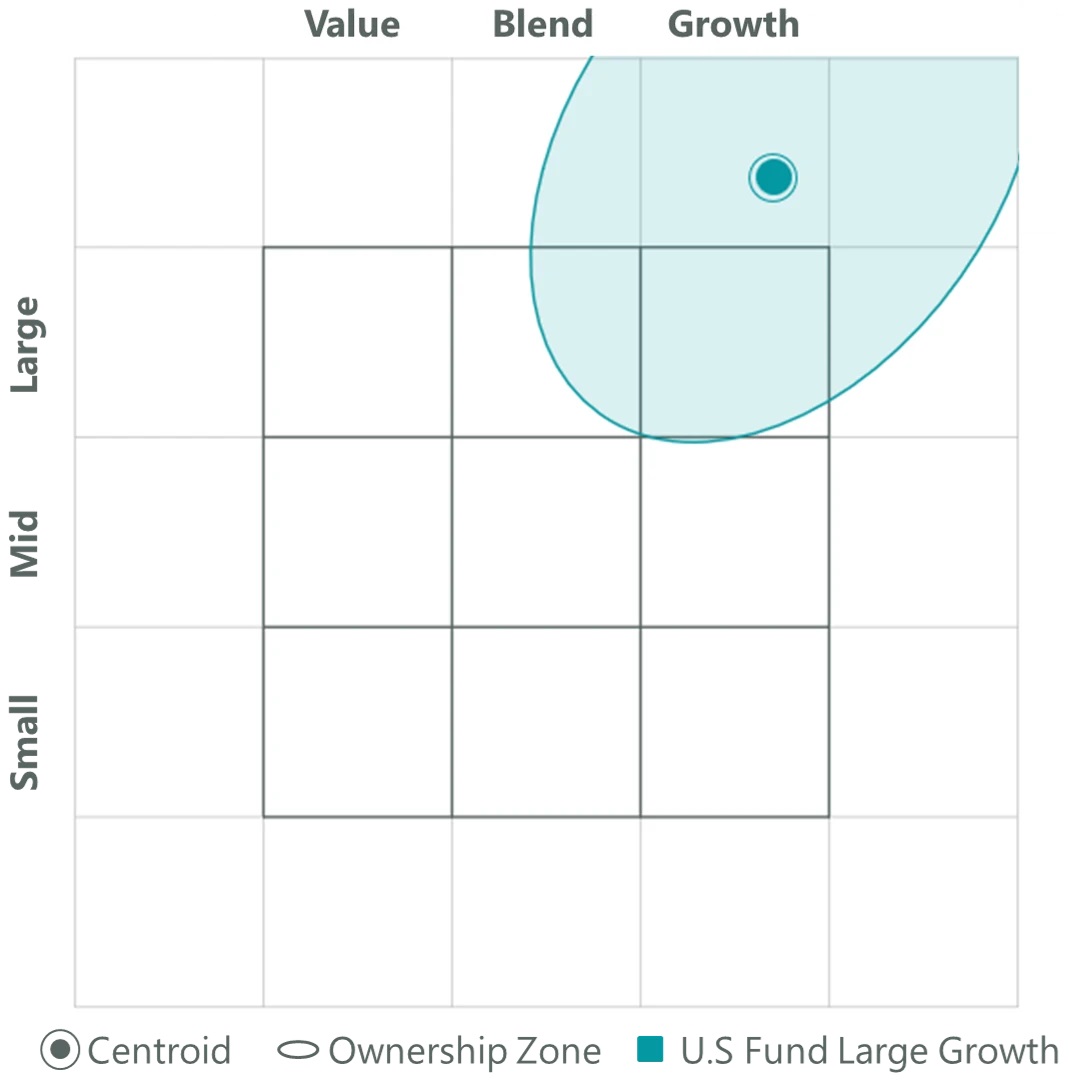
Source: Morningstar (Equity Holdings Style Map). As of January 30, 2024. Past performance is not indicative of future results
Meanwhile, the weighted average market cap of small cap growth and mid cap growth indexes are limited by upper market cap thresholds and through annual rebalancing. By the same token, and in order to stay true to their category, small cap growth and mid cap growth strategies are often forced to sell securities that have appreciated above a certain market cap threshold to prevent their weighted average market cap from drifting too high and to stay style pure. This constrains mid cap growth indexes and strategies from moving larger in market cap.
As a result, we have seen a gap emerge between large cap growth and mid cap growth asset classes. This is evident in the widening disparity in weighted average market cap between the more traditional small cap growth and mid cap growth indexes and the large cap and all cap growth indexes (Russell 1000 Growth and Russell 3000 Growth) which are dominated by the Magnificent Seven (Exhibit 6).
Exhibit 6: Size Gap Between Mid Cap Growth
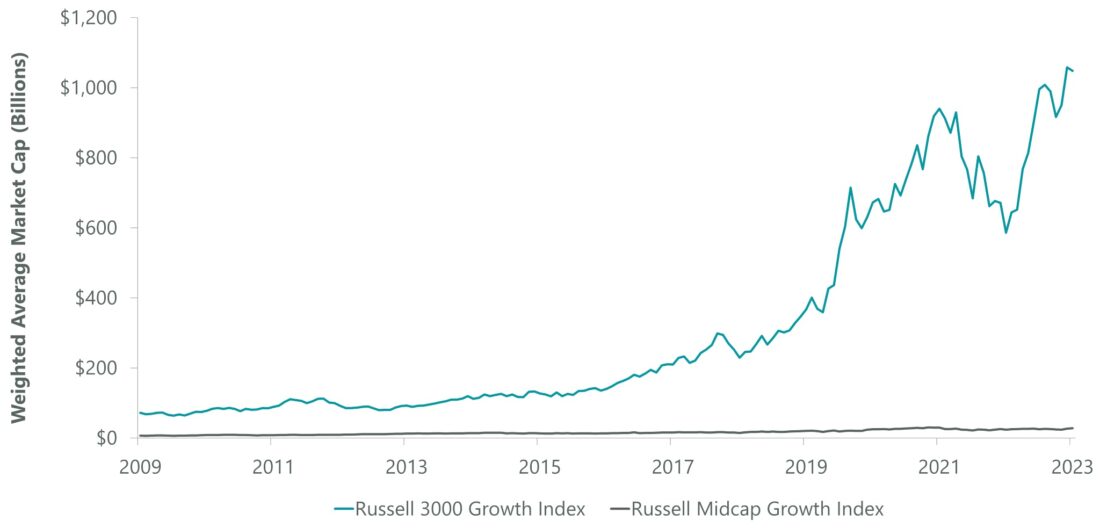
Source: FactSet. As of December 31, 2023. Past performance is not indicative of future results
You can see the same dynamic when comparing the weighted average market cap of the Morningstar large cap growth and mid cap growth peer sets (Exhibit 7). A vacuum has been created between the exposures that these two more traditional asset classes now provide.
Exhibit 7: Disparity in Average Market Caps Across Growth Universe
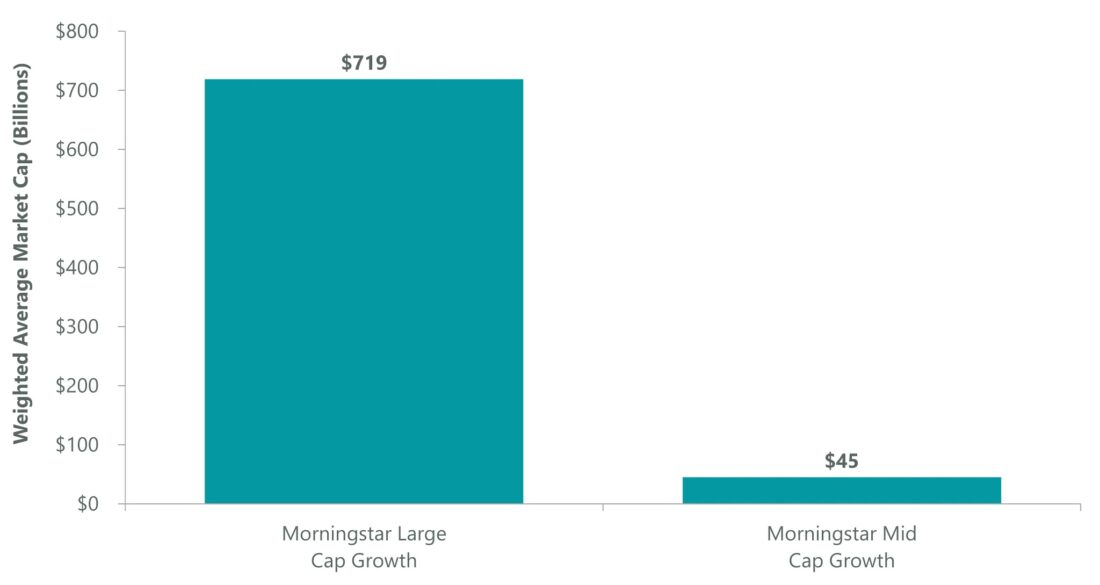
Source: FactSet. As of December 31, 2023. – Past performance is not indicative of future results
Mid cap plus: An overlooked asset class
With both active management peers and passive indexes concentrating elsewhere, there are a number of high-quality growth companies in the upper end of mid cap and the lower end of large cap being less well represented in retail and institutional asset allocations today. Characterized by names in the $10 billion to $100 billion market cap range, we think about this “mid cap plus” universe in terms of market cap percentiles of the index, not a fixed range.
We analyzed how representation of this universe has evolved over time in a growth index like the Russell 3000 Growth. At the end of 2023, the mid cap plus segment of the market constituted less than a quarter of the index, down considerably versus a percentage in the mid to high 30s in the mid 2010s (Exhibit 8). This leaves all cap and large cap allocations with less exposure to this segment of the market than they have enjoyed historically.
Exhibit 8: Mega Cap Crowding Out Everything Below
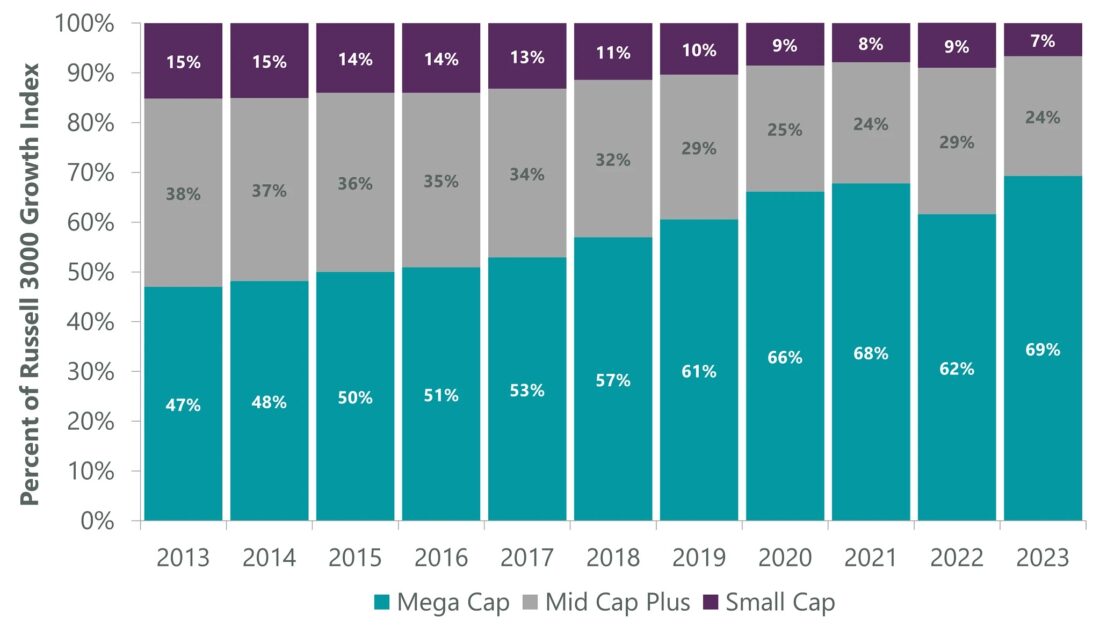
Sources: FactSet, Bloomberg, ClearBridge Investments. As of December 31, 2023. For this analysis, we divided the Russell 3000 Growth Index into three buckets each calendar year-end based on market cap percentiles, as follows: Small Cap below 80th percentile, corresponding to < $10 billion, Mid Cap Plus from 80th percentile to 97th percentile, corresponding to a range of $10 billion to $127 billion, Mega Cap above 97th percentile, corresponding to > $127 billion. Past performance is not indicative of future results
To prove out the merits of investment in the mid cap plus segment of the growth market, we took a cross-sectional look at the Russell 3000 Growth Index. We divided the index into 50 buckets based on monthly market cap back to 1985 with roughly an equal number of names in each segment. For each of these groupings of around 30 names, we calculated the cross-sectional mean return as a measure of expected return from investing in each bucket (Exhibit 9).
Exhibit 9: Superior Long-Term Returns for Mid Cap Plus
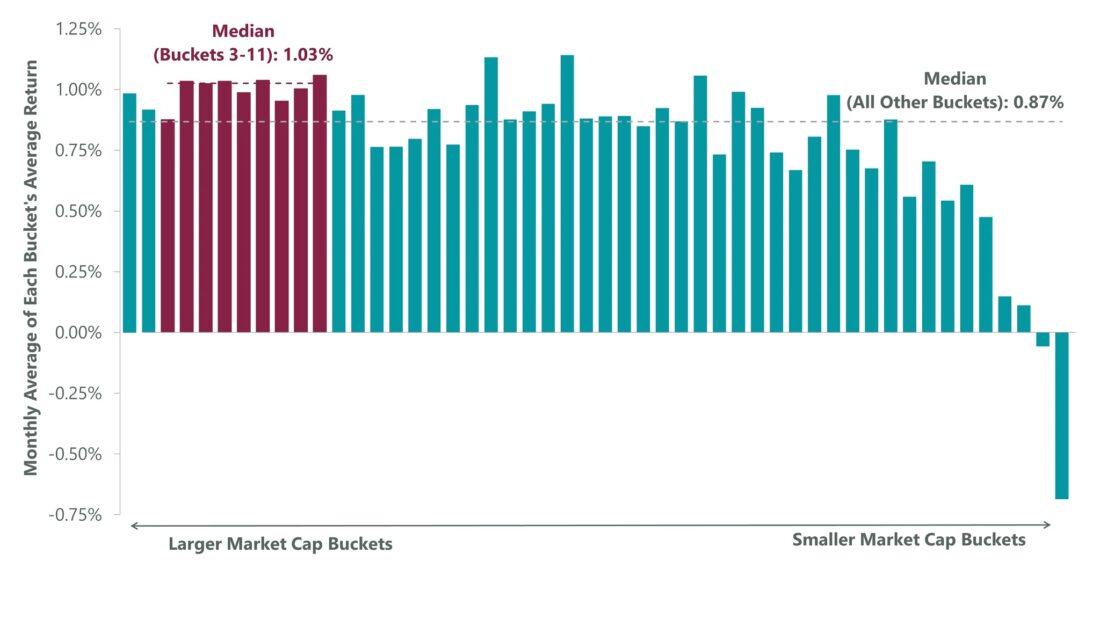
Sources: FactSet, ClearBridge Investments. For this analysis, we divided the Russell 3000 Growth Index into 50 equal-sized buckets sorted by market capitalization (with around 30 names in each bucket) each month from January 1985 to December 2023, calculated each bucket’s average monthly return, and then calculated a monthly average for the entire period. Past performance is not indicative of future results
While returns at the top end of the investment universe in terms of market cap were not poor, average returns in the subsequent buckets (3–11) were consistently higher. This is true up until bucket 12, which corresponds to stocks with a market cap just below $10 billion in today’s terms. Overall, in the past 20+ years, names in the mid cap plus segment have had superior median returns than both larger cap and smaller cap companies. Yet with all cap and large cap active management peers and passive indexes bloated with mega caps, we believe investors remain under allocated to this attractive segment of the market.
Compounding this issue, investors are under allocated to the mid cap growth category more broadly. In terms of market representation, mid cap growth only represents $316 billion in industry assets under management, as compared to large cap growth and small cap growth at $2 trillion and $222 billion, respectively. This is despite a strong return profile, with mid cap growth achieving excess returns as compared to both large cap growth and small cap growth over a long time frame. Over rolling six-month periods from January 1994 to March 2023, mid cap growth outperformed large cap growth 55% of the time with an average excess return of 6.0% in periods of outperformance, according to State Street Global Advisors. Mid cap growth also topped small cap growth 52% of the time with an average excess return of 4.2% when outperforming. Increasingly underserved, we believe investors are missing out on exposure to this desirable asset class.
Active management can capitalize in mid cap plus
While returns in the mid cap plus segment of the market are superior on average, not all stocks in this group are created equal. In fact, as you move down the market cap spectrum, away from mega and larger cap companies, the value of active management increases.
Across the same stratification of the Russell 3000 Growth Index (50 market cap buckets going back to 1985), we calculated cross-sectional standard deviation as a measure of dispersion in returns (Exhibit 10). Dispersion steadily increases as you move down the market cap spectrum, with a noticeable difference between the first and second buckets, which represent mega cap companies (market cap greater than $175 billion) and the lower end of large cap companies (market cap between $96 billion and $175 billion), respectively. Active management is uniquely positioned to help investors pick and ride the winners in this segment.
Exhibit 10: Dispersion Rises as Market Cap Falls
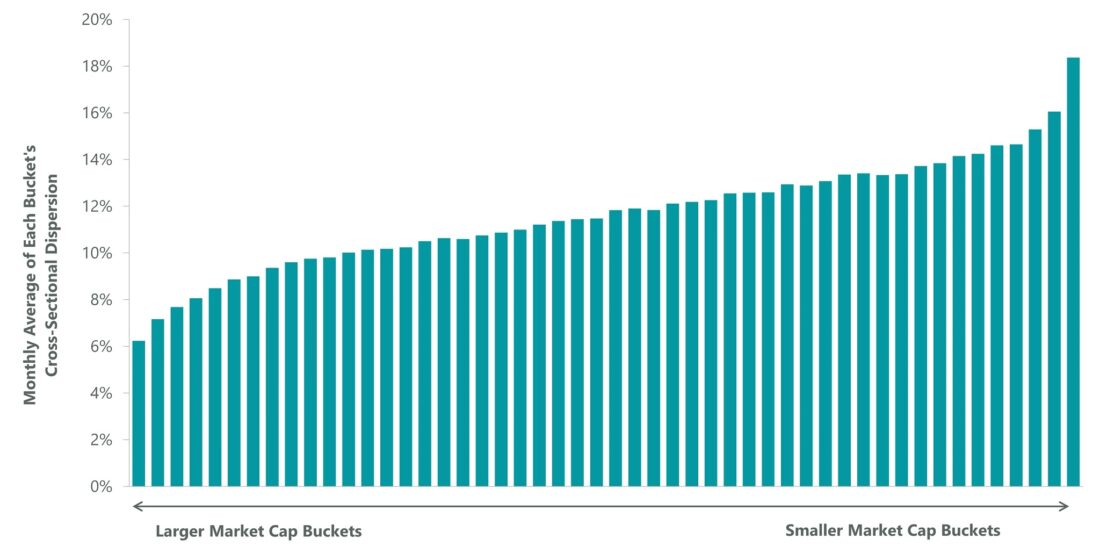
Sources: FactSet, ClearBridge Investments. For this analysis, we divided the Russell 3000 Growth Index into 50 equal-sized buckets sorted by market capitalization (with around 30 names in each bucket) each month from January 1985 to December 2023, calculated each bucket’s average monthly return, and then calculated a monthly average for the entire period. Past performance is not indicative of future results
We believe merger and acquisition (M&A) activity is an important vector of outperformance for this area of the market. M&A is much more prevalent and therefore more likely a driver of alpha as you move down the market cap spectrum. This is clear when looking at the number of deals by size segment based in the Russell 3000 Index over the last 25 years. While deals in Russell’s Top 200 Index are few and far between, annual deal volume is significant as you move down in market cap (Exhibit 11).
Exhibit 11: M&A More Pronounced Outside Large Cap
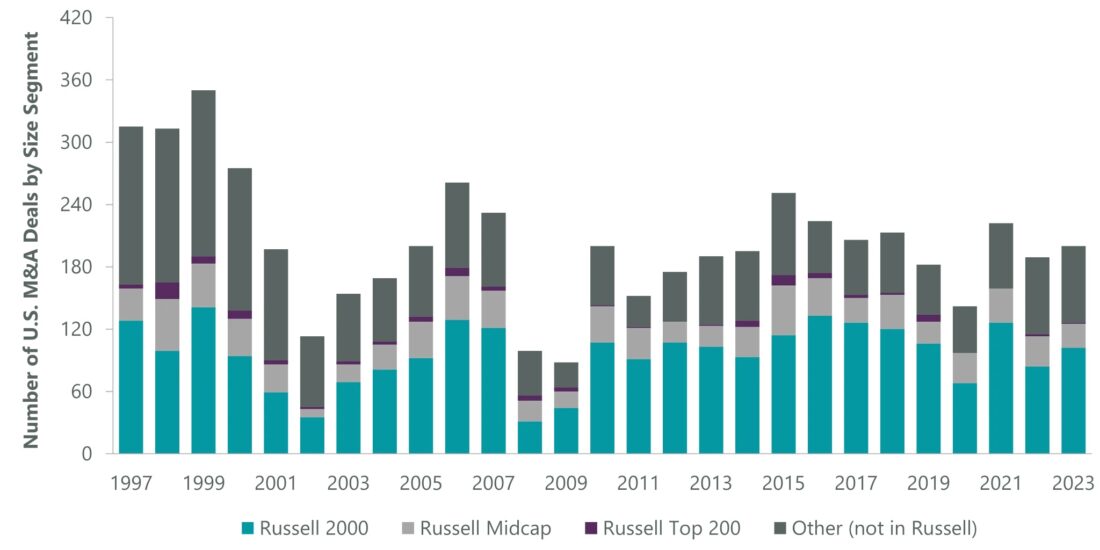
Sources: Bank of America Global Research, FactSet, Securities. As of December 31, 2023. Reprinted by permission. Copyright © 2024 Bank of America Corporation (“BAC”). The use of the above in no way implies that BAC or any of its affiliates endorses the views or interpretation or the use of such information or acts as any endorsement of the use of such information. The information is provided “as is” and none of BAC or any of its affiliates warrants the accuracy or completeness of the information. Past performance is not indicative of future results
We believe the attractive qualities of the mid cap plus segment of the US equity market have been crowded out by the story stocks of the Magnificent Seven. As these mega caps have grown in size and prominence in widely tracked growth indexes, the case for owning mid cap plus companies has only grown, creating a compelling opportunity for active managers to exploit.
Definitions
The Russell 1000 Growth Index measures the performance of the large- cap growth segment of the US equity universe
The Russell 3000 Growth Index measures the performance of the broad growth segment of the US equity universe.
The Russell Top 200 Index measures the performance of the largest cap segment of the US equity universe.
The Magnificent Seven stocks are Amazon.com (AMZN), Apple (AAPL), Google parent Alphabet (GOOGL), Meta Platforms (META), Microsoft (MSFT), Nvidia (NVDA) and Tesla (TSLA).
The S&P 500 Index is an unmanaged index of 500 stocks that is generally representative of the performance of larger companies in the US.
WHAT ARE THE RISKS?
All investments involve risks, including possible loss of principal. Please note that an investor cannot invest directly in an index. Unmanaged index returns do not reflect any fees, expenses or sales charges. Past performance is no guarantee of future results.
Equity securities are subject to price fluctuation and possible loss of principal.
Fixed-income securities involve interest rate, credit, inflation and reinvestment risks; and possible loss of principal. As interest rates rise, the value of fixed income securities falls.
International investments are subject to special risks including currency fluctuations, social, economic and political uncertainties, which could increase volatility. These risks are magnified in emerging markets.
Commodities and currencies contain heightened risk that include market, political, regulatory, and natural conditions and may not be suitable for all investors.
US Treasuries are direct debt obligations issued and backed by the “full faith and credit” of the US government. The US government guarantees the principal and interest payments on US Treasuries when the securities are held to maturity. Unlike US Treasuries, debt securities issued by the federal agencies and instrumentalities and related investments may or may not be backed by the full faith and credit of the US government. Even when the US government guarantees principal and interest payments on securities, this guarantee does not apply to losses resulting from declines in the market value of these securities.
Disclosure: Franklin Templeton
The comments, opinions and analyses expressed herein are for informational purposes only and should not be considered individual investment advice or recommendations to invest in any security or to adopt any investment strategy. Because market and economic conditions are subject to rapid change, comments, opinions and analyses are rendered as of the date of the posting and may change without notice. The material is not intended as a complete analysis of every material fact regarding any country, region, market, industry, investment or strategy.
This information is intended for US residents only.
Disclosure: Interactive Brokers
Information posted on IBKR Campus that is provided by third-parties does NOT constitute a recommendation that you should contract for the services of that third party. Third-party participants who contribute to IBKR Campus are independent of Interactive Brokers and Interactive Brokers does not make any representations or warranties concerning the services offered, their past or future performance, or the accuracy of the information provided by the third party. Past performance is no guarantee of future results.
This material is from Franklin Templeton and is being posted with its permission. The views expressed in this material are solely those of the author and/or Franklin Templeton and Interactive Brokers is not endorsing or recommending any investment or trading discussed in the material. This material is not and should not be construed as an offer to buy or sell any security. It should not be construed as research or investment advice or a recommendation to buy, sell or hold any security or commodity. This material does not and is not intended to take into account the particular financial conditions, investment objectives or requirements of individual customers. Before acting on this material, you should consider whether it is suitable for your particular circumstances and, as necessary, seek professional advice.


