


")


While 2022 main topics in the equities markets tended to be inflation, rising interest rates and conflict in Ukraine, 2023 concerns were the decline in inflation, how much interest rates would continue rising, and hopes that controlled inflation might lead to a lowering of rates.
The first quarter of 2023 got the year off to a good start. The market rose steadily until March, at which point, markets moved sideways without a clear direction for several months. In the month of November, a bullish rally began that looks to continue into 2024.
Using ERO as a European stock market benchmark, an ETF with 425 free float-adjusted market capitalization weighted equities, we can see this ETF gained 15.96% in 2023.
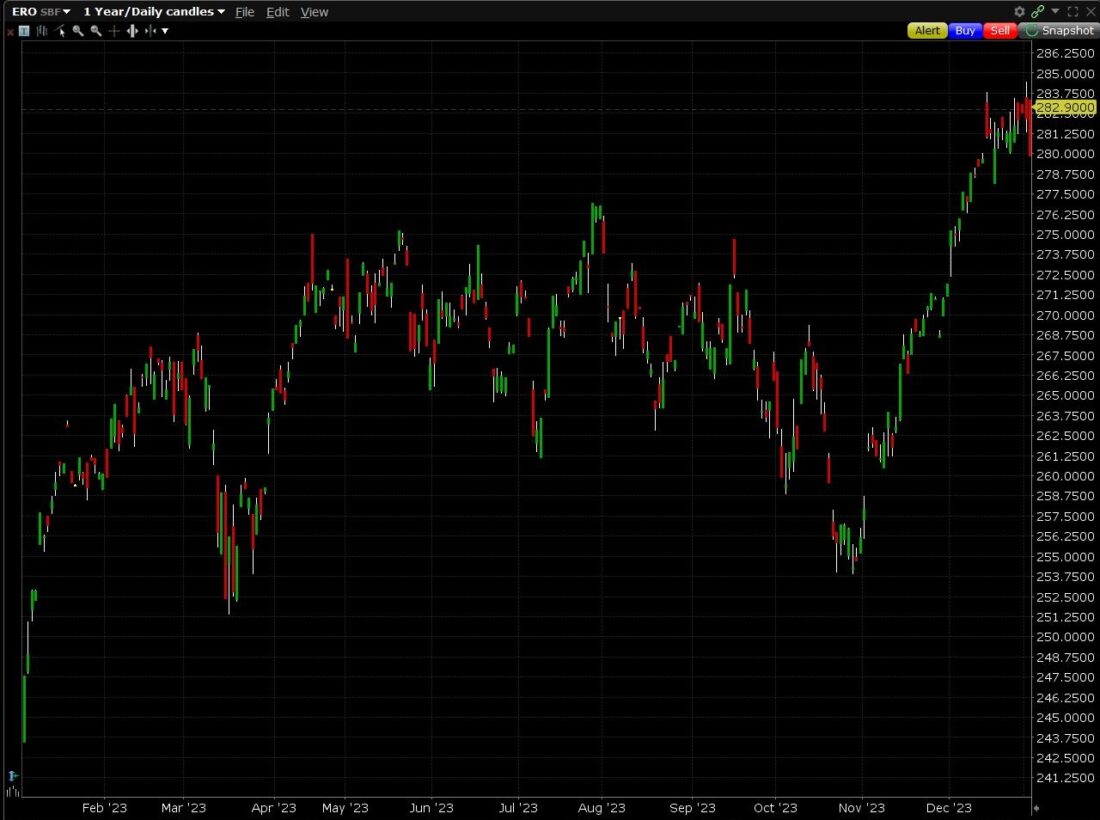
Source: ibkr.ie Past performance is not indicative of future results.
Sector Performance
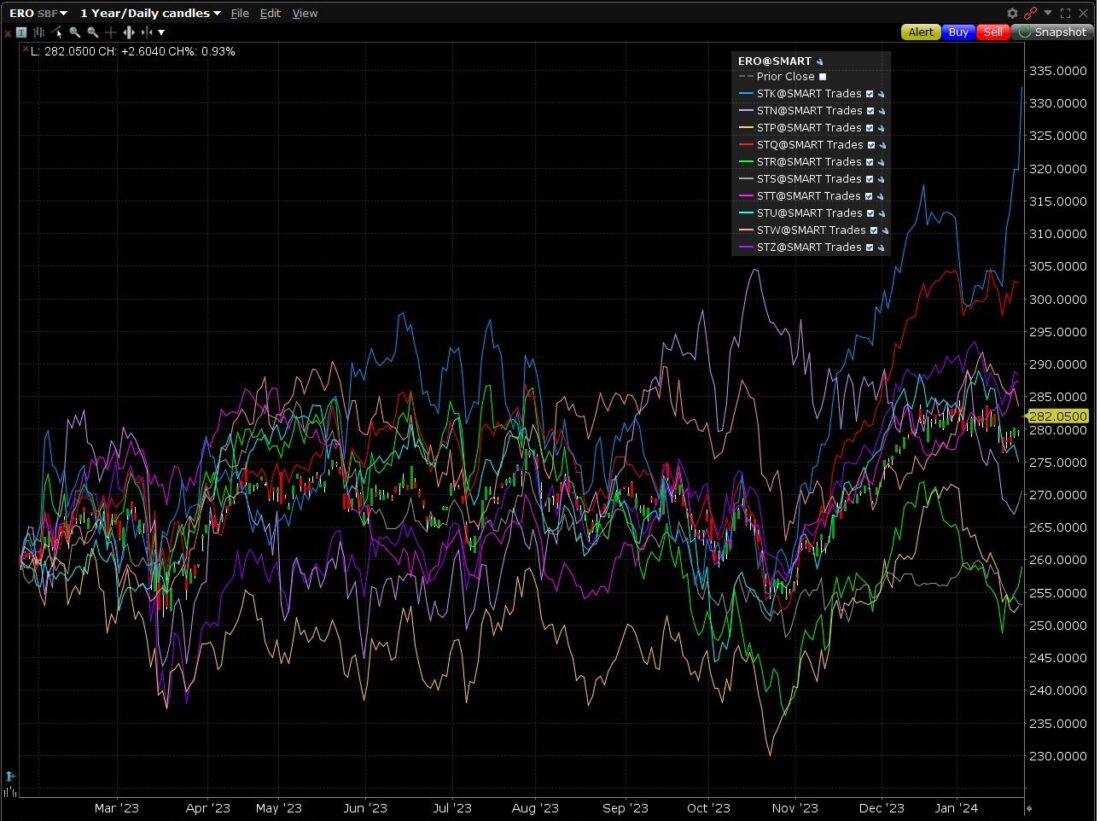
To compare various sectors of European stocks, the SPDR sector ETFs are a good proxy to use. General market sentiment has been positive, although there have clearly been two sectors that have stood out, one due to its extraordinary profitability, and another due to its under-performance, compared to others. Technology rose 35.11% while Consumer Staples rose a meagre 1.49%.
The following table shows the various Sector ETFs performance:
| Name | ISIN | Symbol | Performance 2023 % |
| SPDR® MSCI Europe UCITS ETF | IE00BKWQ0Q14 | ERO | 15.96% |
| SPDR® MSCI Europe Communication Services UCITS ETF | IE00BKWQ0N82 | STT | 15.30% |
| SPDR® MSCI Europe Consumer Discretionary UCITS ETF | IE00BKWQ0C77 | STR | 15.93% |
| SPDR® MSCI Europe Consumer Staples UCITS ETF | IE00BKWQ0D84 | STS | 1.49% |
| SPDR® MSCI Europe Energy UCITS ETF | IE00BKWQ0F09 | STN | 9.02% |
| SPDR® MSCI Europe Financials UCITS ETF | IE00BKWQ0G16 | STZ | 21.97% |
| SPDR® MSCI Europe Health Care UCITS ETF | IE00BKWQ0H23 | STW | 8.40% |
| SPDR® MSCI Europe Industrials UCITS ETF | IE00BKWQ0J47 | STQ | 27.24% |
| SPDR® MSCI Europe Materials UCITS ETF | IE00BKWQ0L68 | STP | 12.65% |
| SPDR® MSCI Europe Technology UCITS ETF | IE00BKWQ0K51 | STK | 35.11% |
| SPDR® MSCI Europe Utilities UCITS ETF | IE00BKWQ0P07 | STU | 13.90% |
Source: ibkr.ie Past performance is not indicative of future results.
Factor Performance
In investing, a factor is any characteristic that can explain the risk and return performance of an asset. In recent years, ETFs mirroring certain factors have been developed making it easier to tailor an investment strategy to whichever factors one would consider important. Examples of factors are Dividend Yield, momentum, volatility, and growth [revenue or EPS].
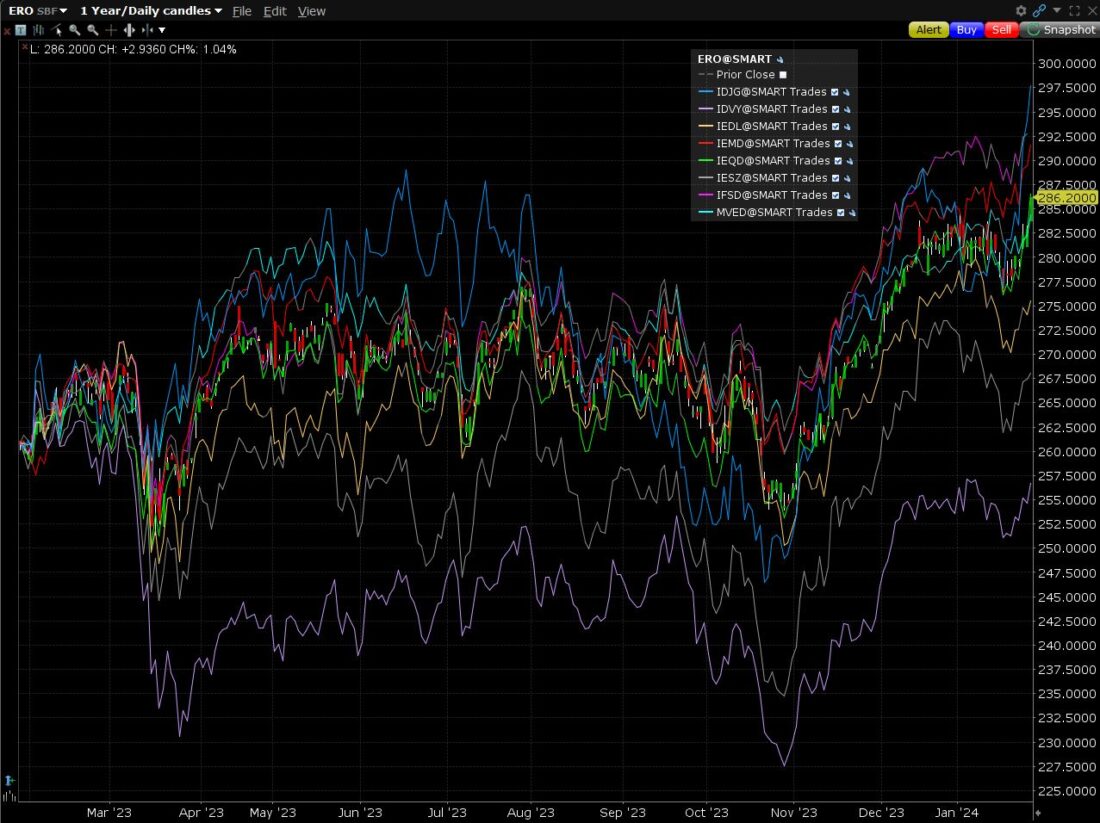
To evaluate performance of different factors in 2023, we are going to use a list of iShares ETFs. Due to greater diversification within the portfolios, the returns of ETFs invested in factors are much closer to the average return of the market, only the Growth factor obtains a return higher than 20% while the Dividend factor has a yield of less than 10%.
The ETFs are the following:
| Name | ISIN | Symbol | 2023 performance % |
| iShares Edge MSCI Europe Size Factor UCITS ETF | IE00BQN1KC32 | IESZ | 14.71% |
| iShares Edge MSCI Europe Quality Factor UCITS ETF | IE00BG13YG34 | IEQD | 15.14% |
| iShares Edge MSCI Europe Value Factor UCITS ETF | IE00BG13YH41 | IEDL | 14.45% |
| iShares Edge MSCI Europe Momentum Factor UCITS ETF | IE00BG13YJ64 | IEMD | 13.40% |
| iShares Edge MSCI Europe Minimum Volatility UCITS ETF | IE00BG13YK79 | MVED | 11.50% |
| iShares Euro Total Market Growth Large UCITS ETF | IE00B0M62V02 | IDJG | 20.86% |
| iShares Euro Dividend UCITS ETF | IE00B0M62S72 | IDVY | 4.50% |
Source: ibkr.ie Past performance is not indicative of future results.
Market Volatility
Regarding overall market volatility, the period of most tension was undoubtedly the month of March 2023, in which US bankruptcies and the rescue of Credit Suisse were the driving forces behind investors fears of a banking panic, but over time the problem did not worsen, and volatility returned to the mean. Due to the bull rally beginning November 2023, the next 3 months saw a decrease in market volatility.
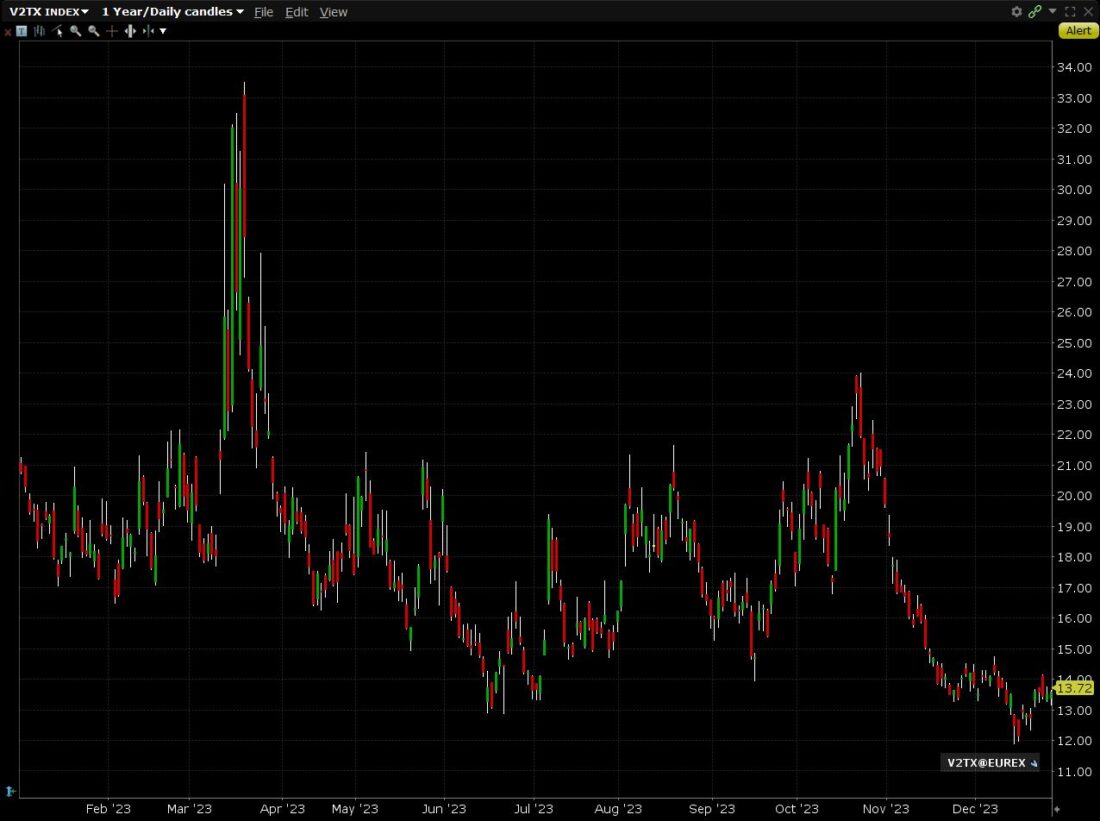
Source: ibkr.ie Past performance is not indicative of future results.
Disclosure: Interactive Brokers
The analysis in this material is provided for information only and is not and should not be construed as an offer to sell or the solicitation of an offer to buy any security. To the extent that this material discusses general market activity, industry or sector trends or other broad-based economic or political conditions, it should not be construed as research or investment advice. To the extent that it includes references to specific securities, commodities, currencies, or other instruments, those references do not constitute a recommendation by IBKR to buy, sell or hold such investments. This material does not and is not intended to take into account the particular financial conditions, investment objectives or requirements of individual customers. Before acting on this material, you should consider whether it is suitable for your particular circumstances and, as necessary, seek professional advice.
The views and opinions expressed herein are those of the author and do not necessarily reflect the views of Interactive Brokers, its affiliates, or its employees.
Disclosure: ETFs
Any discussion or mention of an ETF is not to be construed as recommendation, promotion or solicitation. All investors should review and consider associated investment risks, charges and expenses of the investment company or fund prior to investing. Before acting on this material, you should consider whether it is suitable for your particular circumstances and, as necessary, seek professional advice.
