


The recent price movement in a key commodity – at least for chocoholics like me – illustrated some key tenets about trading highly volatile markets. In recent weeks, cocoa prices have been cuckoo. We had a parabolic rise, extreme backwardation, and now a blowoff from the top. It’s simultaneously highly unusual yet all too familiar.
Let me preface today’s piece by establishing that I have no particular insight into the cocoa market. It is a commodity with worldwide use but dominated by a relatively tight cadre of huge consumers and regional producers, and I’ve never interacted directly with any of them. But I do have quite a bit of experience in trading and analyzing extraordinary market moves. And cocoa’s recent runup and even more recent plunge fit a broadly similar pattern.
Below is a chart showing cocoa futures’ recent moves:
Rolling Front Month NYBOT Cocoa Futures, 6-Month Daily Candles
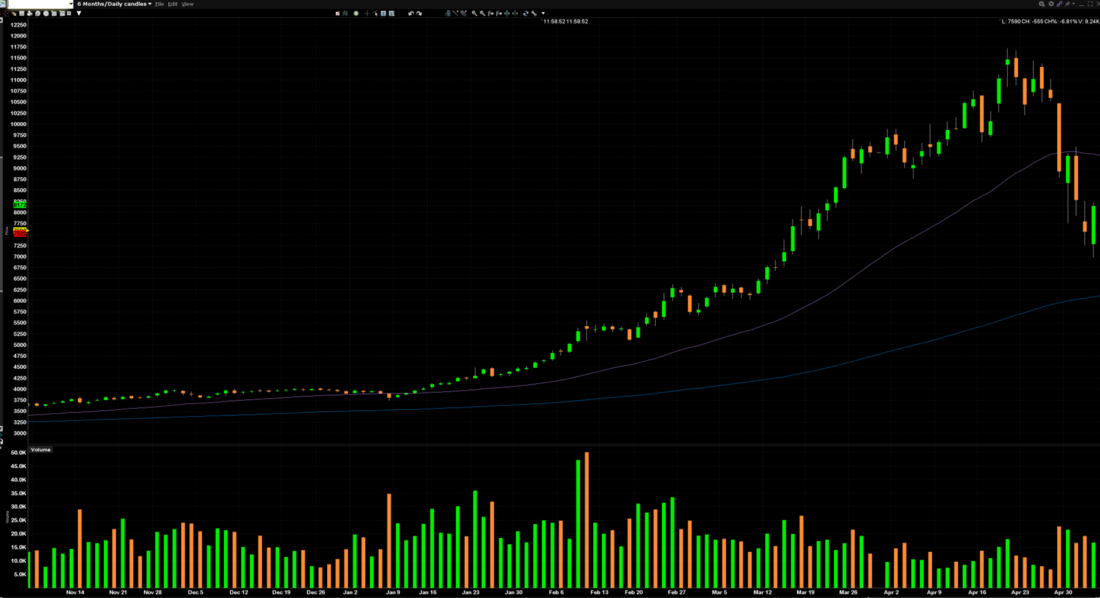
Source: Interactive Brokers
Past performance is not indicative of future results
The obvious takeaway is that the price of cocoa roughly tripled between the start of the year and mid-April. But as with many stellar moves, this one began slowly and rather inauspiciously. The price meandered in the $3500-$4000 range for months before bottoming with a bit of a volume spike in early January. The price appreciation from that point on was solid, and while it seems relatively unspectacular compared to what transpired later, the commodity rose over 30% with a bit of a parabola into the huge volume spike that occurred in February. From that point onward, it was relatively straight up for the commodity. Financial media could hardly ignore the advance that followed, which undoubtedly brought in a wider range of speculators. The overall volumes tended to dip even as the rapidity of the advance was increasing. We then saw a bit of intense volatility in mid-April that eventually turned into the major price correction that we see now.
There are three key truisms that we would like to highlight today:
- Parabolic moves: A frequent theme of ours is that “parabolic charts mean someone is in pain.” We wrote consecutive articles in March 2022, when various commodities were launching higher in an inflationary frenzy. The latter shared the title linked above, while the former elaborated on a recently taped podcast discussion with Thomas Peterffy about trend following. After relating some of the podcast’s key points, we elaborated:
Commodities charts have become downright scary. Most of them are in backwardation – implying a short-term scarcity in the underlying commodity – and some, like oil and wheat, have gone parabolic in recent sessions. Parabolic uptrends are almost always unsustainable for long periods of time and tend to reverse abruptly and sharply. The question is when. Parabolic uptrends imply that some group is desperate for the commodity or security in question. In the case of stocks, that tends to resolve itself naturally. In the case of necessities, like the commodities having the most extreme moves, supply/demand can take longer to equilibrate. Can they reverse tomorrow? Sure. When will they actually reverse? Ummm….
In a bout of prescient timing, the nickel market imploded in between when the first and second pieces were published.
The takeaway here is that while it can be incredibly tempting to chase a parabolic move, you are ultimately trying to exploit someone else’s agony. This is not a moral statement, but instead is meant to illustrate why trading parabolic moves can be so dangerous. At some point, the original impetus for the panicky move abates. That leaves a group of speculators trading against each other, many of whom have no particular expertise in the commodity in question. And that is when the reversal begins, albeit unpredictably.
- Backwardation: When we graph the term structure of commodities, it is typical to see the line slope upward from bottom left to top right. That implies that a futures market is in contango, meaning that there is a normal relationship between supply and demand. The opposite is called backwardation, implying that there is an excess of demand for the commodity relative to the available supply. Remember, for most commodities, it is difficult to increase supply in the short term, even if demand can change in a matter of minutes. We saw extreme backwardation in cocoa:
Term Structure of NYBOT Cocoa Futures, Today (yellow) 1 week ago (red)
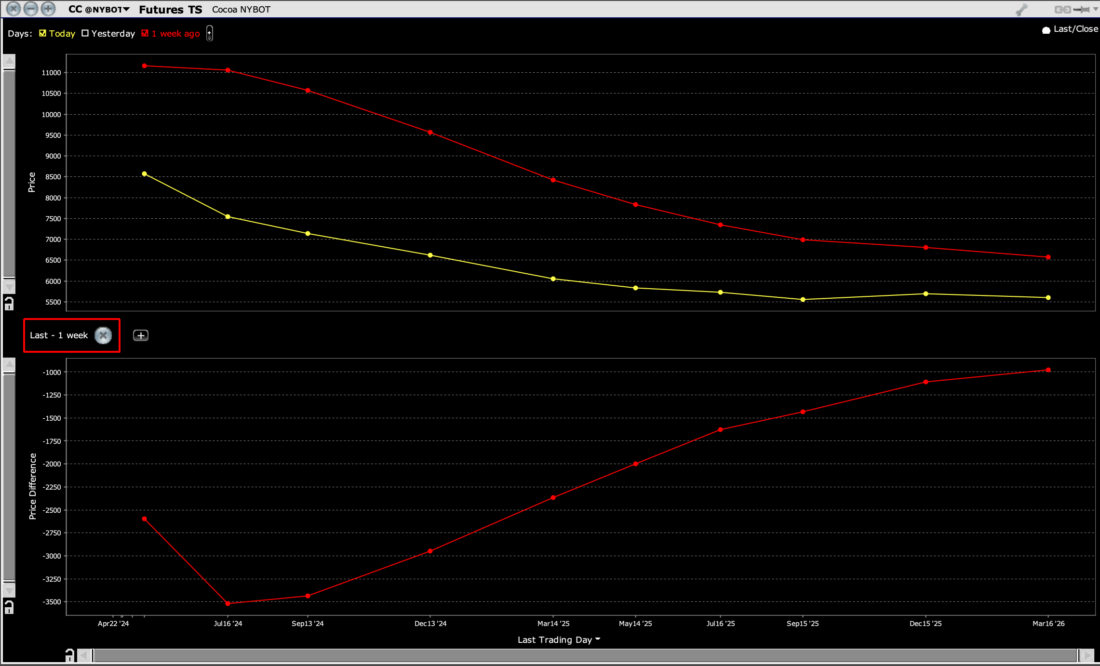
Source: Interactive Brokers
Past performance is not indicative of future results
We can see that while the backwardation has decreased over the past week, it still remains quite substantial. That tells us that while the price pressures have eased considerably, the market is currently far from normal and should warrant continued caution from speculators.
- Volatility Tends to Increase Around Turning Points: This is a market adage that, like many, makes sense over time. Note that cocoa traded in relatively tight daily ranges even as the price rally steepened and even went parabolic in spots. Then, notice that the daily price moves widened as the move petered out and began to reverse. Unfortunately, this is not a perfect indicator. It tends to be obvious in hindsight, but not necessarily when it is occurring. Yet if someone is tempted to ride an upswing higher, it behooves that trader to be extremely vigilant about when the move might be showing signs of strain. It could mean that one with tight stops could get stopped out prematurely. But I’d rather give up some profit than risk a more significant loss.
Disclosure: Interactive Brokers
The analysis in this material is provided for information only and is not and should not be construed as an offer to sell or the solicitation of an offer to buy any security. To the extent that this material discusses general market activity, industry or sector trends or other broad-based economic or political conditions, it should not be construed as research or investment advice. To the extent that it includes references to specific securities, commodities, currencies, or other instruments, those references do not constitute a recommendation by IBKR to buy, sell or hold such investments. This material does not and is not intended to take into account the particular financial conditions, investment objectives or requirements of individual customers. Before acting on this material, you should consider whether it is suitable for your particular circumstances and, as necessary, seek professional advice.
The views and opinions expressed herein are those of the author and do not necessarily reflect the views of Interactive Brokers, its affiliates, or its employees.
Disclosure: Futures Trading
Futures are not suitable for all investors. The amount you may lose may be greater than your initial investment. Before trading futures, please read the CFTC Risk Disclosure. A copy and additional information are available at the Warnings and Disclosures section of your local Interactive Brokers website.
Disclosure: Order Types / TWS
The order types available through Interactive Brokers Trader Workstation are designed to help you limit your loss and/or lock in a profit. Market conditions and other factors may affect execution. In general, orders guarantee a fill or guarantee a price, but not both. In extreme market conditions, an order may either be executed at a different price than anticipated or may not be filled in the marketplace.
