


")


Originally posted, 29 November 2023 – Fixed Income Outlook 2024: Do the math
Jim Cielinski, Global Head of Fixed Income, explores why in the context of extreme bond market volatility, the math at the core of fixed income argues for a more rewarding outlook for the asset class in 2024.

The shift away from low and sub-zero yields was always going to be challenging for much of the fixed income universe. The good news about higher yields is that they make it mathematically more difficult to post negative fixed income returns and much easier to generate positive returns. As we look ahead to 2024, the world of math can offer some useful lessons about what fixed income markets may have in store.
Calculating returns: the asymmetric risk-reward profile
Bond prices move inversely with the change in their yield. When yields fall, bond prices rise and vice versa. Yields have soared over the past three years but with them seemingly peaking, we think the prospects for bonds in 2024 look increasingly bright. The table below highlights how the income from bonds provides a cushion against higher rates, while any decline in yields offers the prospect of returns enhanced by capital gains.
Fig 1: Total return matrix for US Treasuries under different yield change scenarios
Estimated 12-month total return (%)

Source: Bloomberg, using current US Treasury bonds at specified maturities, as at 17 November 2023. For illustrative purposes only, estimated returns reflect assumptions based only on changes in bond yields/interest rates and no other factors. There is no guarantee that forecasts will be realised. Yields may vary and are not guaranteed.
Probability: peak policy rates offer a high likelihood of positive returns
Central banks have done a reasonably good job of putting the inflation genie back in the bottle. Notwithstanding some idiosyncratic shock – geopolitics and El Niño weather are obvious candidates – the path of least resistance for inflation is down. Excluding the stubborn rental component of the Consumer Price Index (CPI), US inflation is running at circa 2%.1 Wage pressures are moderating, and futures markets already reckon that the US Federal Reserve (the Fed) is done with hiking interest rates.2 Past performance is not necessarily a guide, but history has shown that government bonds typically perform well after the last hike.
Figure 2: US 10-year Treasury total return in different tightening cycles
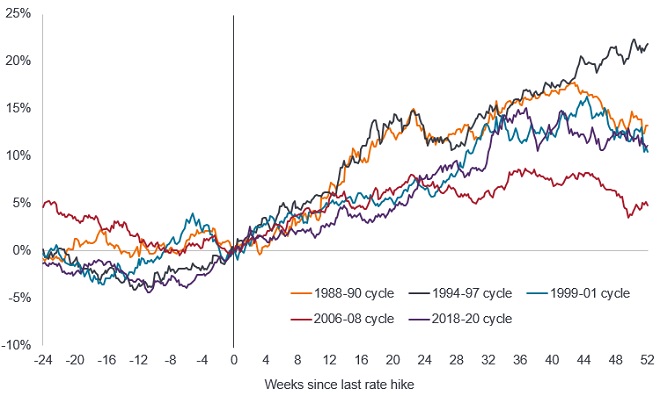
Source: LSEG Datastream, US Federal Reserve Target Rate peaks in cycle, Benchmark US 10-year Government Bond Total Return Index, in USD. Date of last rate hike in each cycle period: 1988-90 (24 Feb 1989), 1994-97 (01 Feb 1995), 1999-01 (16 May 2000), 2006-08 (29 June 2006), 2018-20 (20 Dec 2018). Past performance does not predict future returns.
The elusive soft landing
Monetary policy acts with long and variable lags. There are two problems with this. One, lead times are long. Two, lead times are variable! The extraordinary path of pandemic-related policy makes this cycle different than any other in history, and policy has made its way down from a very high mountain.
Markets have been elated with well-behaved inflation and employment data. They have quickly concluded that rate hikes are over and that the next stop is a soft landing – modestly positive growth with contained inflation. This is the one troublesome part of the outlook. The soft-landing expectation precedes most recessions. In the last six recessions, five of them were preceded by commentators anticipating a soft-landing (the Covid-19 recession being the exception).3 These expectations most often end in tears. The odds of a soft-landing have certainly improved, but are overestimated. Leading indicators remain weak, liquidity is poor and real rates restrictive, making a harder landing more likely. At the very least, markets will contend at some point with a growth scare in the coming year. We anticipate a good time to buy risk assets will present itself in the next 12 months, but it has not arrived yet.
Curves: the return of upward-sloping yield curves
Given our expectation that central banks will start easing rates next year, the shorter part of the yield curve should see yields move lower. Throughout 2023 the yield curve remained inverted – shorter-dated bonds yielded more than longer-dated bonds. The inversion lessened in the second half of 2023 and it is likely that 2024 will bring about more normal upward-sloping yield curves, with shorter-dated bonds yielding less than longer-dated bonds.
Figure 3: Yield curve inversion should lessen
The yield on a 10-year government bond minus the yield on a 2-year government bond

Source: Bloomberg, US 2s10s curve, Germany 2s10s curve, 30 November 1993 to 20 November 2023. Basis point (bp) equals 1/100 of a percentage point, 1bp = 0.01%. Yields may vary over time and are not guaranteed.
This is likely to have implications for allocation, with investors keener to lock in longer-dated yields. Bonds with longer maturities have higher duration (sensitivity to changes in interest rates). With rates set to fall, we see 2024 as a year in which owning duration could be rewarding.
There will be a limit, however, to how much short rates can fall in 2024. The Fed’s preferred measure of inflation (core Personal Consumption Expenditure) is still above target at 3.7%.4 Although rate cuts are likely to unfold in the US, markets have begun to price in such an outcome. Inflation will be well-behaved, but until it moves closer to the 2% target, central banks will move cautiously and ensure they maintain their inflation fighting credentials. This is particularly true in the Eurozone, where the European Central Bank has a tightly defined mandate focused on price stability.
Ratios: signals from corporate fundamentals
For bond investors ratios matter, particularly those related to a company’s financial strength. A widely followed ratio is the leverage ratio (net debt/earnings) which loosely details how many years it would take to pay back debt. Another key ratio is interest coverage (earnings/interest expense), which is a measure of how easily a company can pay interest on its outstanding debt. These have been deteriorating recently and we expect this deterioration to worsen in 2024.
With nominal economic growth fading, companies should find it tougher to grow their top-line revenues. Cost pressures will remain, however, and may worsen as companies will need to refinance at higher rates than were available a few years ago. This is expected to separate the ‘haves’ (those companies with strong balance sheets and cash flow generating potential) from the ‘have nots’ (those companies with stressed balance sheets who will struggle to roll over their debts). It will be important to watch disinflation.
Refinancing will separate the ‘haves’ from the ‘have nots’.
Decompression (credit spreads widening as you move down the credit spectrum in response to negative news) was not much in evidence outside of CCC-rated corporate bonds during 2023. This was because moves in government bond yields tended to dominate returns. We think 2024 will see decompression return, however, as greater attention is paid to corporate fundamentals, providing a strong environment for active management. In this environment, we favour being higher in quality, preferring investment grade debt over high yield and higher quality segments of the loans market.
Correlation: the return of equity-bond diversification
One relationship that has been valuable for investors historically has been the capacity for government bonds to offer a hedge against weakness in equity markets. This was because in recent decades equity and bond returns typically had a negative correlation, i.e. when one moved up, the other moved down. This negative correlation tends to break down in periods of high inflation – such as 2023 – because the higher inflation is the cause of both higher rates and elevated recessionary fears. Traditional relationships should reassert themselves when inflation moves below 3%, something we expect to happen in 2024.
Figure 4: Negative correlation should reassert itself as core CPI falls below 3%

Source: Bloomberg, 3-year correlation of Bloomberg US Treasury Total return Index with S&P 500® Total Return Index, plotted against 3-year average US Core Consumer Price Index (inflation), monthly data, February 1973 to October 2023. Past performance does not predict future returns.
Throughout 2023 we liked better quality asset-backed securities for their high yields and/or diversification qualities. These themes remain for 2024. We continue to find agency mortgage-backed securities (MBS) attractive. Yields above 5% for an asset class with low volatility continues to make them a useful income generator and diversifier within portfolios.5
Fixed income has come full circle
We believe 2024 to be a critical transition year. Investors should keep a watchful eye on disinflation – the decline in the rate of inflation – as there is a big difference between whether it is demand led (recessionary) or supply led (better productivity, declining trade costs and bottlenecks). China will either be a meaningful plus or minus for the global economy, depending on their approach to stimulus. Faltering European growth could yet set the agenda. Attention will re-focus on imprudent fiscal spending, and we could see volatility as several major economies gear up for elections.
Risks, therefore, have not gone away but we think it is time to dig out your compass and protractor. Fixed income markets have come full circle. With the reset in yields they are reassuming their traditional role of offering both an attractive level of income and diversification against risk assets.
Disclosure: Janus Henderson
The opinions and views expressed are as of the date published and are subject to change without notice. They are for information purposes only and should not be used or construed as an offer to sell, a solicitation of an offer to buy, or a recommendation to buy, sell or hold any security, investment strategy or market sector. No forecasts can be guaranteed. Opinions and examples are meant as an illustration of broader themes and are not an indication of trading intent. It is not intended to indicate or imply that any illustration/example mentioned is now or was ever held in any portfolio. Janus Henderson Group plc through its subsidiaries may manage investment products with a financial interest in securities mentioned herein and any comments should not be construed as a reflection on the past or future profitability. There is no guarantee that the information supplied is accurate, complete, or timely, nor are there any warranties with regards to the results obtained from its use. Past performance is no guarantee of future results. Investing involves risk, including the possible loss of principal and fluctuation of value.
Disclosure: Interactive Brokers
Information posted on IBKR Campus that is provided by third-parties does NOT constitute a recommendation that you should contract for the services of that third party. Third-party participants who contribute to IBKR Campus are independent of Interactive Brokers and Interactive Brokers does not make any representations or warranties concerning the services offered, their past or future performance, or the accuracy of the information provided by the third party. Past performance is no guarantee of future results.
This material is from Janus Henderson and is being posted with its permission. The views expressed in this material are solely those of the author and/or Janus Henderson and Interactive Brokers is not endorsing or recommending any investment or trading discussed in the material. This material is not and should not be construed as an offer to buy or sell any security. It should not be construed as research or investment advice or a recommendation to buy, sell or hold any security or commodity. This material does not and is not intended to take into account the particular financial conditions, investment objectives or requirements of individual customers. Before acting on this material, you should consider whether it is suitable for your particular circumstances and, as necessary, seek professional advice.
Disclosure: Bonds
As with all investments, your capital is at risk.
