


")


Potential China Inflection: FXI ETF
1/ FXI Monthly
2/ FXI Monthly Momentum
3/ FXI Weekly
4/ FXI Daily
5/ Relative Strength Ratio Chart Weekly: China/Japan, China/World and China/India
6/ MSCI Japan (EWJ) Monthly
Investopedia is partnering with CMT Association on this newsletter. The contents of this newsletter are for informational and educational purposes only, however, and do not constitute investing advice. The guest authors, which may sell research to investors, and may trade or hold positions in securities mentioned herein do not represent the views of CMT Association or Investopedia. Please consult a financial advisor for investment recommendations and services.
Potential China Inflection: FXI ETF

Past performance is not indicative of future results
Conclusion: FXI has reached a potential inflection point. The outcome of the current technical setup is likely to define the direction over coming months, and result in significant low risk trading opportunities.
FXI, is the China Large Cap ETF that holds the 50 largest large cap Chinese stocks trading on the Hong Kong exchange. FXI is currently in the process of making a secondary test of its 2022 low. Either a successful test leads to a show of strength, or a failed test creates a show of weakness. Either outcome has the potential to produce a meaningful directional move offering multiple trading opportunities. This is precisely the kind of setup or juncture around which I like to build agnostic trading plans. Either way, I will have a trading and risk management plan in place to take advantage of either outcome. In a macro sense, there isn’t much going on in China that leads me to optimism. China is a command economy run by a communist regime in the process of retreating from capitalism. Importantly, leadership seems to be increasingly resistant to providing adequate fiscal stimulus. To that list you can add a rapidly aging population, a world increasingly resistant to buying their goods, a rethinking of global supply lines and significant raw material and climate challenges. Granted, there are positives. They are becoming a microchip superpower, and over the last five years have made some very significant technological advances. In my view, the negatives outweigh the positives by quite a lot.
My macro view informs my aggressiveness and risk tolerance. But, if a technical setup provides a clear risk reward advantage, a conflicted macro view never deters me from making a trade. Technical setups are far more actionable than fundamental beliefs. And it is always good to remember that the more widely accepted a viewpoint becomes, the more susceptible a market becomes to mean reversion or reversal.
1/ FXI Monthly

Past performance is not indicative of future results
RECAP:
● FXI is confined within the larger 13.43 – 50.80 range that developed since the ETF
began trading (four years after China joined the World Trade Organization),
● In 2021, after slightly up-thrusting the October 2007 high, the market began a vicious decline (-60%). The decline from the February 2021 high occurred on rising volume and wide price spread (suggesting strong handed selling). The move was clearly impulsive.
● In early 2022 FXI fell out of the broad rising channel (A-B, C-D) that had defined the general price action for most of the prior 15 years.
● The fall out of the channel created strong selling, but a temporary selling climax developed (arrow) as the market reached the lateral support at 23.05 and opportunistic buying emerged.
● The minor climax produced a small automatic rally that quickly ran into resistance along the lows of the broken channel. The market then devolved into a 4 month show of weakness.
● The show of weakness occurred on wide price spread and growing volume, before potentially developing a complex selling climax (SC). Note that, while in this perspective the SC appears complex, it appears more traditional in the daily perspective.
● The automatic rally (AR) lasted 4 months and found resistance in the same 32-33.00 zone that had turned the market lower in March of 2022.
● After testing the resistance the market began setting back toward the selling climax low (19.81). Note that during the most recent decline, the angle of decline has been shallower than that of the larger (50.80 – 19.81) decline and that the volume has been somewhat lighter. The shallower angle and the lighter volume suggests far less supply entering than on the prior decline.
● The recent pullback toward the October 2022 low may be developing as a secondary test. The outcome of that test is likely to develop into a significant directional move.
● The solid expansion of volume around the recent low (ST?) suggests strong handed buying and that the secondary test may be complete pending a show of strength.
2/ FXI Monthly Momentum

Past performance is not indicative of future results
Momentum:
● Momentum is diverging significantly from price and the MACD histogram has turned positive. This oscillator condition combined with a show of strength from this position in the trend would be extremely positive.
● Price has been confined in the lower portion of the Bollinger band since July of 2021. A push into the upper half of the band would mark a significant change in the market’s character. Note that the B-band is narrow. Narrow B-bands often immediately precede trending moves.
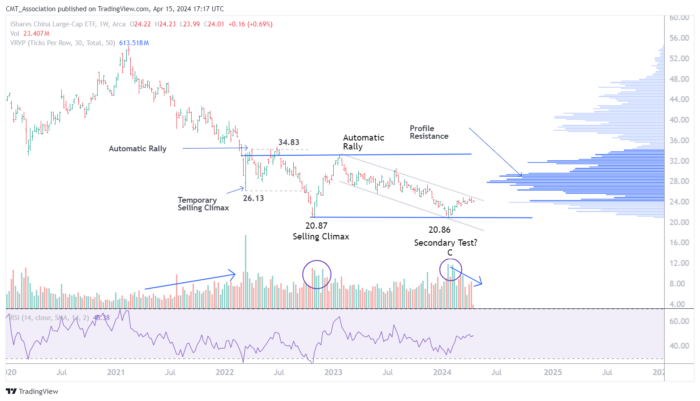
3/ FXI Weekly

Past performance is not indicative of future results
After evaluating the monthly perspective I move to the weekly perspective. In my own trading, I prefer to trade in this (the weekly) perspective.
● The price/volume relationships detailed in the monthly perspective are more easily seen.
● The false selling climax at A, the complex climax at B, the automatic rally to 32.36 and finally, the low volume decline (note the shallow angle) to point C.
● The strong volume at point C suggests that strong hands may be accumulating shares around the prior low.
● As the market has advanced from the 20.86 low, volume and price spread have been declining. While supply seems limited, demand is still lacking. Odds of a setback to test 20.86 or perhaps even to provide a fuller test of the 19.81 low are still quite good.
● I think it’s premature to conclude that the secondary test is complete. But if the market begins working its way above the downtrend that is defining the potential test (A-B), particularly if volume and price spread expand, would likely signal a completed test. This would allow me to begin utilizing bullish setups with a high degree of confidence.
4/ FXI Daily

Past performance is not indicative of future results
I finally evaluate the daily perspective to see if the larger price and volume characteristics still hold in the detail.
● The initial selling climax (SC) stands out more clearly. Note that this was a large gap day lower (opened far below the prior days close) but closed will off the low of the day.
● The drift lower (A-B) is well defined, has occurred on generally low volume, and the angle of the testing decline is shallow.
● I prefer secondary tests that are well separated in terms of time and that come close to fully retracing the climax structure. This structure certainly qualifies in both respects. I would prefer to see a deeper cut toward the 19.81 low, but 20.86 is close enough.
● Note that volume has declined markedly and price spread has narrowed as the market rallied over the last few weeks. This is not ideal and suggests that the secondary test structure may be incomplete.
● A show of strength above the A-B would suffice to suggest that a good bottom was in. If that level is exceeded, entering bull flags and other corrective style drift patterns should provide good entries.
5/ Relative Strength Ratio Chart Weekly: China/Japan, China/World and China/India

Past performance is not indicative of future results
These are monthly relative strength charts, comparing FIX to MSCI Japan, MSCI World and MSCI India. China has consistently underperformed all. To become optimistic for anything beyond a trading turn would require the Chinese market to begin to markedly strengthen relative to the rest of the world.
6/ MSCI Japan (EWJ) Monthly

Past performance is not indicative of future results
The China/Japan ratio is particularly interesting.
● Just as China is testing an important low, Japan is testing its 2021 high.
● Potential divergences are setting up both in the price chart of EWJ and the spread chart of China/Japan.
● This sets up a potential long term spread trade, particularly if China makes a sign of strength as Japan makes a show of weakness.
In my process the final step is the sanity check. Am I falling prey to behavioral bias? Am I being dispassionate? Is my belief system compromising my impartiality? I have to conclude that in the case of China, that may well be so. I don’t like the Chinese government and am loath to invest there for anything other than a trading turn. Historically, command economies that are becoming less free tend to make for lousy investments. They are also subject to step function changes due to changes in policy, wrecking risk management overlays. Clearly my strongly held view may compromise my read of the FXI chart. Because of this I will need to pay greater than normal attention to how I build my trading plan. And finally, many of the topics and techniques discussed in this post are part of the CMT Associations Chartered Market Technician’s curriculum.
—
Originally posted 30th April, 2024
Disclosure: Investopedia
Investopedia.com: The comments, opinions and analyses expressed herein are for informational purposes only and should not be considered individual investment advice or recommendations to invest in any security or to adopt any investment strategy. While we believe the information provided herein is reliable, we do not warrant its accuracy or completeness. The views and strategies described on our content may not be suitable for all investors. Because market and economic conditions are subject to rapid change, all comments, opinions and analyses contained within our content are rendered as of the date of the posting and may change without notice. The material is not intended as a complete analysis of every material fact regarding any country, region, market, industry, investment or strategy. This information is intended for US residents only.
Disclosure: Interactive Brokers
Information posted on IBKR Campus that is provided by third-parties does NOT constitute a recommendation that you should contract for the services of that third party. Third-party participants who contribute to IBKR Campus are independent of Interactive Brokers and Interactive Brokers does not make any representations or warranties concerning the services offered, their past or future performance, or the accuracy of the information provided by the third party. Past performance is no guarantee of future results.
This material is from Investopedia and is being posted with its permission. The views expressed in this material are solely those of the author and/or Investopedia and Interactive Brokers is not endorsing or recommending any investment or trading discussed in the material. This material is not and should not be construed as an offer to buy or sell any security. It should not be construed as research or investment advice or a recommendation to buy, sell or hold any security or commodity. This material does not and is not intended to take into account the particular financial conditions, investment objectives or requirements of individual customers. Before acting on this material, you should consider whether it is suitable for your particular circumstances and, as necessary, seek professional advice.
Disclosure: ETFs
Any discussion or mention of an ETF is not to be construed as recommendation, promotion or solicitation. All investors should review and consider associated investment risks, charges and expenses of the investment company or fund prior to investing. Before acting on this material, you should consider whether it is suitable for your particular circumstances and, as necessary, seek professional advice.
