


")


Originally Posted, 11 April 2024 – US Preference shares – forgotten asset class or a hidden jewel?
After the Global Financial crisis, Preference shares fell out of favour, as they are mainly financials, and suffered substantial losses. Partly because of the reputational damage, they are issued on high relative yields, despite having short call dates (of 5-10 yrs), and offer interest rate protection when rates rise.
- Preference shares suffered severe reputational damage in the GFC, but the financial system now has substantial capital buffers and reduced leverage, reducing systemic risks substantially.
- Prefs are mostly issued by high quality financial institutions, and offer interest rate protection.
- Investors are paid higher yields because Prefs are subordinated to senior bonds.
Hybrid asset classes like preference shares[1] (“prefs”) are often omitted in mainstream coverage of financial markets, which typically focuses on bonds or equities.
But there are good reasons for investors not to disregard prefs. In this note we assess the characteristics of prefs and similar hybrid issues and explain why they can offer an attractive alternative to both equities and bonds.
The FTSE US Preferred Stock and Hybrids index, which we focus on in this note, includes some Tier 1 bank bonds in addition to preference shares. However, the index only includes those Tier 1 bonds (otherwise known as Contingent Convertible bonds or CoCos ) where conversion into equity is at the discretion of the regulator.
What are prefs?
Traditionally, US prefs are issued as permanent securities (or “perps”), and generally by banks and insurers. Financials like issuing prefs because, unlike senior bonds, US regulators count prefs as regulatory (i.e., loss-absorbing) capital under Basel 3[2]. They are normally callable after 5 to 10 years.
Figure 1 shows the key features of US prefs and compares them with ordinary equity, senior bonds and Tier 1 bonds from the perspective of the overall corporate capital structure.
Figure 1: US preference shares and the corporate capital structure
| Characteristics | Ordinary equity | Senior bonds | Preference shares (banks’ Tier 2 capital) | Additional Tier 1 (AT1) capital/Contingent Convertibles (CoCos) |
|---|---|---|---|---|
| Maturity/duration | Permanent | Fixed | Permanent but callable | Permanent but callable |
| Dividend/Cpn. deferral | Yes | No | Yes | Yes |
| Voting rights | Yes | No | Only “Participating Prefs” | No |
| Issuer option to call | No | Rarely | Yes | Yes |
| Different interest rate structures – fixed/floating | No | Some | Yes | Yes |
| Basel 3 Regulatory capital | Yes | No | Yes | Yes |
| Loss-absorbing capital | Yes | No | Yes | Yes |
| Contractual conversion rights | No | No | Yes | Yes |
| Risk-on/risk-off asset class | Risk-on | Mixed | Risk-on | Risk-on |
| Interest rate risk | Some | High | Lower | Lower |
Source: FTSE Russell. Past performance is no guarantee of future results. Please see the disclaimer for important legal disclosures.
Prefs’ call option protects against rate rises…
For investors, an attractive feature of prefs is that they have call options at relatively short dates, as well as variable rate structures. In addition, some convert from fixed to floating coupons. Unlike a fixed-coupon bond, a pref that converts from a fixed to a floating coupon protects investors against rising rates, since the probability of the bond being called increases as short rates increase.
…but shortens duration and convexity
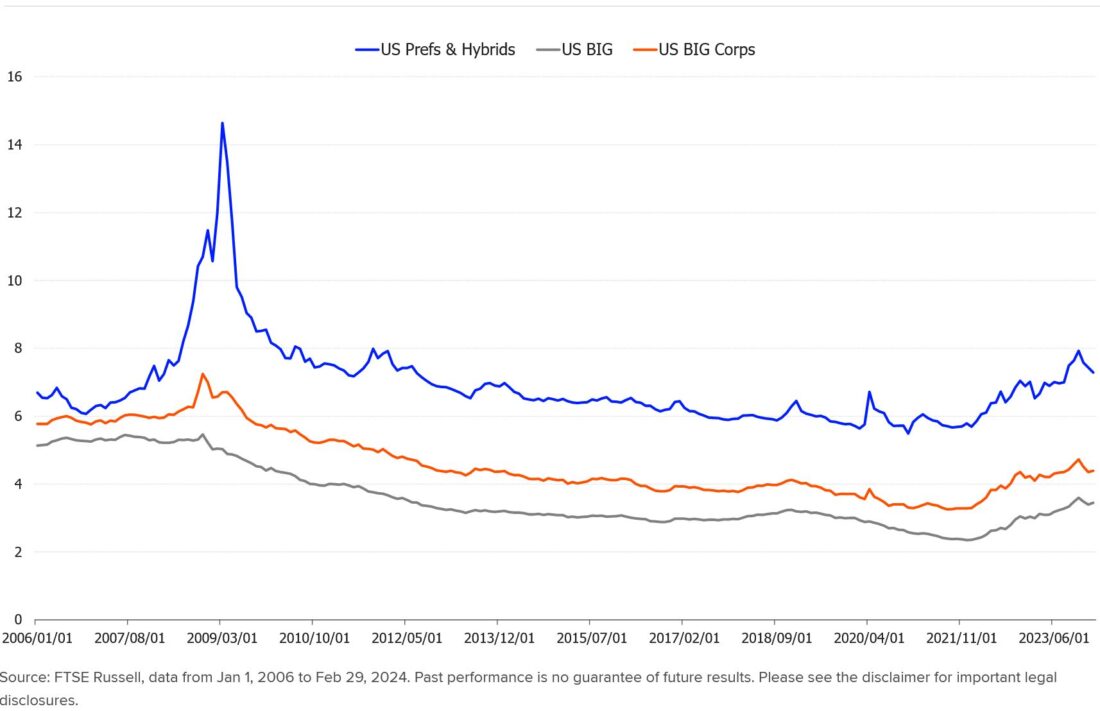
The issuer’s option to call prefs reduces the effective duration and convexity of the bond (because of the “pull to par” as the call date approaches). As well as having lower duration, the junior position of prefs in the capital structure (and their longer contractual maturities) means that they typically trade at higher yields than conventional fixed-rate corporate bonds issued by financials (see Figure 2).
Figure 3 shows that investment-grade (IG) credit was much more exposed than the prefs index to the sharp rise in US Treasury yields in 2022-23, reflecting IG’s longer duration.
By comparison with ordinary equity, however, prefs rank higher in the capital structure. This means that pref investors face lower default risk and a more secure income stream by comparison with dividend-paying bank shares.
Figure 2: Preferred and Hybrids Index vs Broad Inv.Grade bonds
| Index | Number of Issues | Yield to Maturity % | Effective Duration (yrs) | Average coupon % | Market Value $bn |
|---|---|---|---|---|---|
| FTSE US Preferred & Hybrids Index | 608 | 6.84 | 3.95 | 6.61 | 344.292 |
| FTSE US BIG Index | 9,713 | 4.94 | 6.1 | 3.17 | 26,005 |
| FTSE US BIG Corp Index | 8,924 | 5.44 | 6.85 | 4.09 | 7,734 |
Source: FTSE Russell, as at Feb 29, 2024. Past performance is not a guide to future returns.
Figure 3: Yields on prefs and investment-grade bonds
Prefs have higher credit quality than high-yield
Prefs also tend to have higher credit ratings and lower default rates than high-yield (“HY”) bonds which pay similar yields. This reflects the high proportion of financial issuers, where default rates have historically been lower than in other sectors. In the FTSE US Preferred Stock and Hybrids index, for example, financials comprised 73% of the overall index as at February 2024. The only other sizeable sector was utilities (with a weight of 9%).
Ratings reflect position in the capital structure
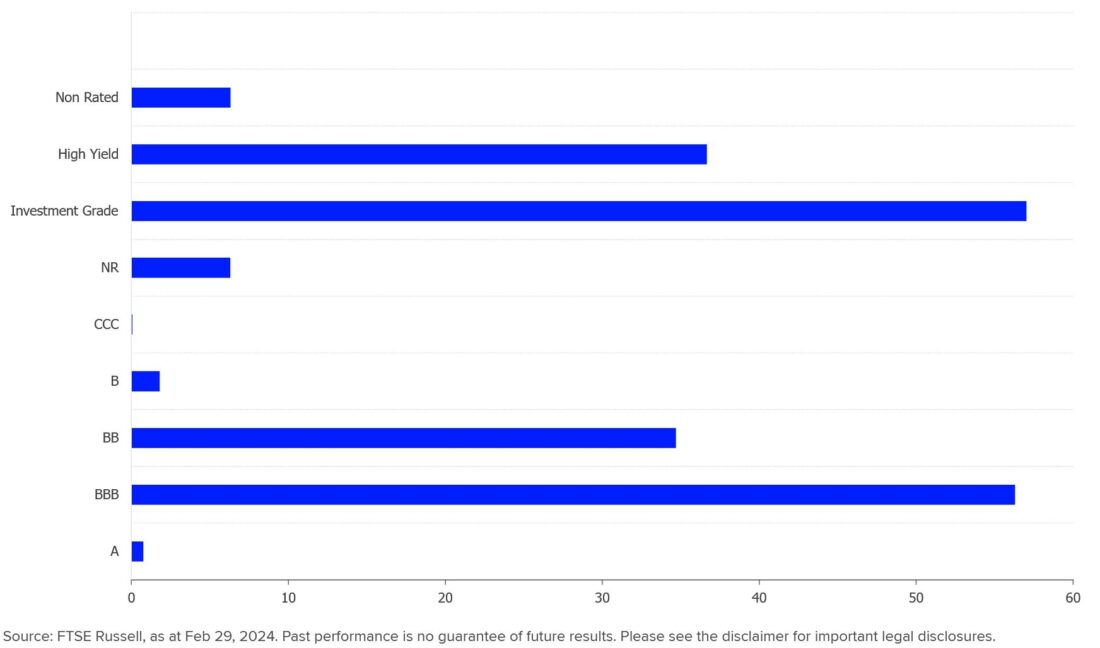
Because prefs are subordinated to senior bonds in the capital structure, they receive lower credit ratings. This puts prefs in the “cross-over” category between IG and HY. However, the resulting yield pick-up (by comparison with IG) reflects the lower position of prefs in the capital structure, rather than lower issuer quality (in fact, many of the bigger pref issuers are highly rated banks and insurers). Figure 4 shows the credit rating categories of the FTSE US Preferred Stock and Hybrids index constituents.
Figure 4: Credit ratings of FTSE US Prefs. & Hybrids index (%)
Prefs’ performance since the 2000s
As a hybrid asset, prefs’ performance is influenced by several factors—most notably the economic cycle, overall movements in credit quality, regulatory treatment and the shape of the yield curve.
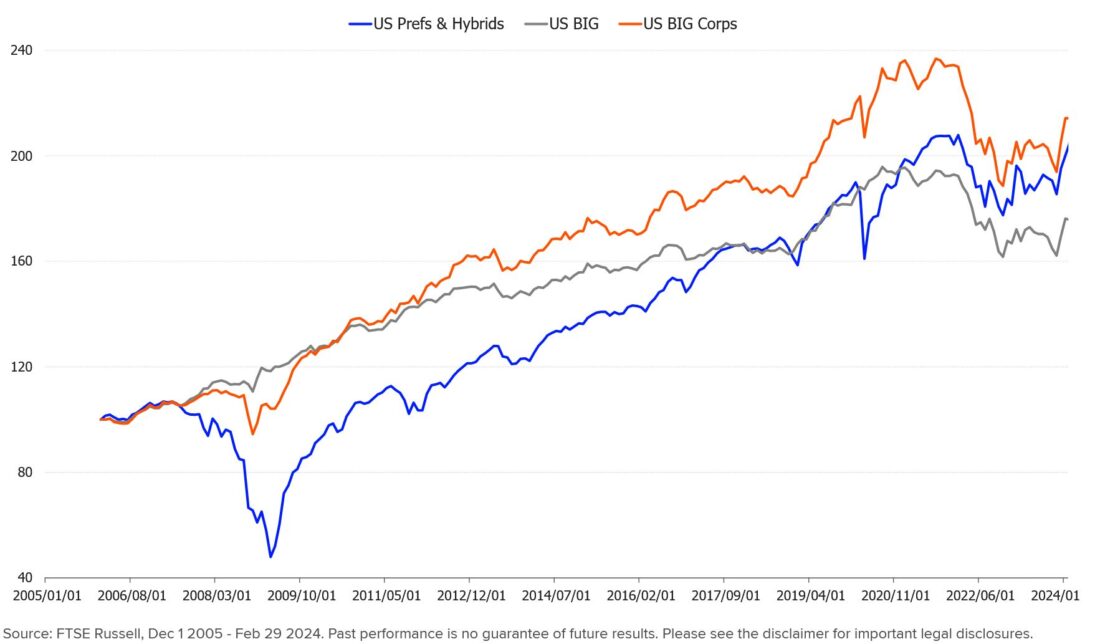
Prefs suffered their biggest past drawdowns during the major deflationary shocks of the GFC and Covid (and particularly the GFC, given the concentration of pref issuance in the financial sector—see Figure 5).
However, prefs rallied strongly in 2009-10, after the Fed implemented zero rates and quantitative easing (QE), resulting in a sharp steepening of the US yield curve. Prefs rallied again strongly in 2020-22, post-Covid.
Figure 5: Relative returns of Prefs & Hybrids versus BIG & BIG Corporates index.
Reduced risks from financial instability
The enforced post-2008 re-capitalisation of the banking sector, combined with reduced leverage and much tougher regulation, all mean that systemic risks are now much lower in the banking sector. This is confirmed by bank Tier 1 capital ratios, which are well above regulatory minimum levels.
It is true that the March 2023 US regional banking crisis and the collapse of Credit Suisse showed that deeply subordinated Tier 1 paper, like contingent convertible bank bonds (“CoCos”), are indeed “total loss-absorbing capital” (“TLAC”). As aforementioned, the FTSE US Preferred Stock and hybrids index only includes those CoCos where conversion into equity is at the discretion of the regulator.
…with cyclical risks mainly in downswings or bouts of risk-aversion
Because financial stress increases the risk of an extension of maturities, prefs tend to perform pro-cyclically, with a higher beta than straight bonds with no calls. In extremis, some prefs may turn from bonds into equities, as the corporate issuer uses the flexibility that the conversion rights allow. This makes prefs a risk-on asset, with a higher correlation to equities than US Treasuries, as Figure 6 shows. There has been a modest increase in the correlation of prefs with Treasuries in the last 1-3 years, during the Fed tightening period, but the correlation is negligibile over the full history of the index.
Figure 6: Correlation of FTSE US Preferred Stock and Hybrids index with other assets
| Term | US Broad investment grade Corp. | US High Yield | Equities Russell 3000 | US Treasuries |
|---|---|---|---|---|
| Full History | 62.20% | 72.70% | 63.90% | 5.10% |
| 10-year | 53.10% | 79.30% | 69.50% | 26.10% |
| 5-Year | 54.70% | 84.80% | 75.70% | 26.30% |
| 3-Year | 69.70% | 77.80% | 69.80% | 60.00% |
| 1-Year | 47.70% | 70.20% | 62.00% | 35.70% |
Source: FTSE Russell – Data from Dec 2005 to Feb 29th 2024. Past performance is no guarantee of future results. Please see the disclaimer for important legal disclosures.
Prefs index is less diverse and standardised than IG
Prefs indices have less sector diversity than broader market indices. This is shown in the number of issues comprising the FTSE US Preferred Stock and Hybrids index (608 versus 8,924 in the FTSE Corporate BIG index, see Figure 3). Prefs are also less standardised than senior bonds, given their variable call dates, covenant protections and conversion rights.
But relative yields offer protection
These features and risks all help explain why prefs trade on higher yields than fixed-rate credit. However, an argument can be made that investors are compensated by prefs’ yield pick-up and reduced duration (given the sharp rise in interest rates, high duration proved the biggest threat to investors in 2022-24).
Finally, with the US yield curve currently near record levels of inversion, and the Fed perhaps likely to ease policy in 2024-25, some yield curve steepening might be expected.
Curve steepening benefits financials as it improves net interest income from borrowing short and lending long. Similarly, any associated tightening in credit spreads would help financials as this would reduce borrowing costs and boost margins.
1. Shares which pay dividends on a preferred basis, relative to the underlying equity, and at a scheduled date, like a bond coupon.
2. The Basel 3 Accord (2013) increased bank capital requirements to a minimum 8%, including 4.5% of common equity, 1.5% of AT1 capital, and 2% of Tier 2 capital.
Disclosure: London Stock Exchange
This publication does not constitute an offer to buy or sell, or a solicitation of an offer to sell, any securities, or the solicitation of a proxy, by any person in any jurisdiction in which such an offer or solicitation is not authorised, or in which the person making such an offer or solicitation is not qualified to do so, or to any person to whom it is unlawful to make such an offer or solicitation. London Stock Exchange has taken reasonable efforts to ensure that the information contained in this publication is correct at the time of going to press, but shall not be liable for decisions made in reliance on it. Therefore, please note that this publication may be updated at any time. The information contained in this publication and any other publications referred herein are for guidance purposes only. London Stock Exchange and the coat of arms device are registered trade marks of London Stock Exchange plc.
Disclosure: Interactive Brokers
Information posted on IBKR Campus that is provided by third-parties does NOT constitute a recommendation that you should contract for the services of that third party. Third-party participants who contribute to IBKR Campus are independent of Interactive Brokers and Interactive Brokers does not make any representations or warranties concerning the services offered, their past or future performance, or the accuracy of the information provided by the third party. Past performance is no guarantee of future results.
This material is from London Stock Exchange and is being posted with its permission. The views expressed in this material are solely those of the author and/or London Stock Exchange and Interactive Brokers is not endorsing or recommending any investment or trading discussed in the material. This material is not and should not be construed as an offer to buy or sell any security. It should not be construed as research or investment advice or a recommendation to buy, sell or hold any security or commodity. This material does not and is not intended to take into account the particular financial conditions, investment objectives or requirements of individual customers. Before acting on this material, you should consider whether it is suitable for your particular circumstances and, as necessary, seek professional advice.
Disclosure: Bonds
As with all investments, your capital is at risk.
