


Originally Posted, 24 April 2024 – What Drives Long-Term Treasury Yields
The drivers of short-dated U.S. Treasury yields are relatively clear. But what are the factors that affect long-term yields? In general, two-year Treasury yields can be seen as a compounding of two years’ worth of daily federal funds rate expectations, with small adjustments for liquidity disparities and other factors. However, when it comes to 10-year Treasuries, factors like inflation, economic growth and Federal Reserve’s (Fed) monetary policy, among others, play important roles. In this article, we will explain how these factors affect the 10-year Treasury yields.
Inflation and Economic Growth
Long-term yields are considered to be determined by a combination of expected inflation and a risk premium. As such, the expectation of increased (reduced) inflation in the future could lead to fixed-income investments becoming less (more) appealing as investors aim for returns that match or exceed the anticipated change in inflation.
Economic growth expectations also impact long-term Treasury yields. Investors demand a higher yield further out on the yield curve due to uncertainty over growth, while the yield curve can also be inverted – near-term yields higher than longer-term returns – amid the potential for a slowdown or a recession, as is the case currently.
In our discussion, we aim to introduce a new consideration that could impact longer-term Treasury yields in the years ahead. Specifically, we’ll explore how the Fed’s accommodative monetary policy, including quantitative easing (QE) resulting in negative real short-term rates, may have affected the 10-year yield. Furthermore, we’ll examine how this dynamic could undergo significant changes as the Fed returns to its previous practice of setting the federal funds rate above prevailing inflation expectations during periods of economic growth.
In our analysis of economic growth, we’ve opted to concentrate on Personal Consumption Expenditures (PCE) rather than GDP for two main reasons. First, the categories of personal consumption form the basis of the weightings in the core PCE price index that the Fed uses as its inflation target. Second, when individuals are employed and enjoy wage increases, their spending power increases.
It is worth considering how the 10-year Treasury yield moved historically with inflation and the state of the economy. There were quite a few deviations and they contribute to some interesting findings. For the 1960s and 1970s, the predominant theme was a continuous underestimation of rising inflation, with occasional exceptions. From 1965 to 1969, the inflation rate increased to around 5%, which provided the backdrop for a decade of high inflation. In the 1970s, the money supply expansion, along with the oil crisis, sent inflation into the double digits. This was the decade of “stagflation” with low growth, high unemployment, weaker personal consumption yet higher inflation. After inflation peaked in the early 1980s, 10-year yields showed some inertia. The period 1982 to 1993 marks a decade of continuous disinflation in which inflation expectations did not come down as fast as the actual inflation rate, while the economy in the 1980s grew relatively well. The key is bond yields lagged nominal growth in PCE both on the way up and again on the way down. In order words, to the extent that bond yields are tied to nominal growth in PCE, they tended to become anchored to past rates of growth rather than correctly anticipating faster or slower nominal growth in the future. They are reactive and not anticipatory.
Figure 1: 10-year Treasury Yield and PCE Growth, 1962-1992
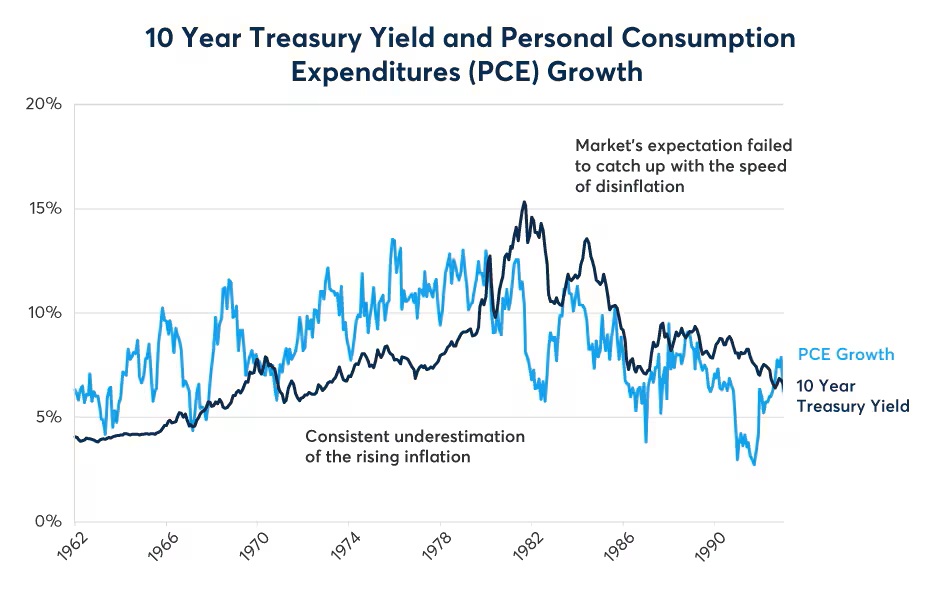
Chart Created by CME Group Economics.
Source: Bloomberg Professional (USGG10YR), FRED (PCE) – Past performance is not indicative of future results
The U.S. economy from 1993-2020 was in a low, stable inflation environment the whole time but economic growth and employment levels varied considerably.
The period 1993 to 1999 was the start of a long period of steady 2%-3% inflation. Bond yields reflected the lower, and more stable, inflation rate, with considerably lower volatility.
Figure 2: 10-year Treasury Yield and PCE Growth, 1993-1999

Chart Created by CME Group Economics.
Source: Bloomberg Professional (USGG10YR), FRED (PCE) – Past performance is not indicative of future results
Early in the 21st century, the “dot com bubble” and “tech wreck” recession hit equities and the US economy, with the Treasury yield moving accordingly amid a flight to quality assets. But the impact was much smaller compared to the financial crisis of 2008 and the deep recession that followed.
Figure 3: 10-year Treasury Yield and PCE Growth, 2000-2007
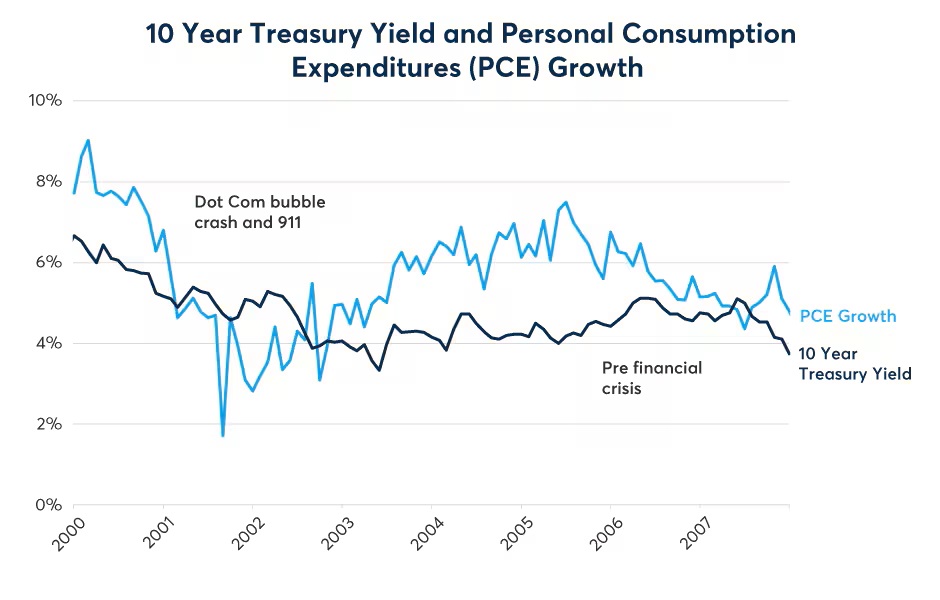
Chart Created by CME Group Economics.
Source: Bloomberg Professional (USGG10YR), FRED (PCE) – Past performance is not indicative of future results
Federal Reserve Balance Sheet
The Great Recession led to the first quantitative easing (QE) in the history of the Fed, pushing federal funds to near zero, with the real interest rate below zero for a decade. During this period of negative real short-term rates, we observed a significant deviation in the pattern between the 10-year yield and PCE growth, with the 10-year yield trending well below what one might have expected in a positive real rate environment. One potential explanation is that negative real interest rates were considered to be outliers of economic history, and the public didn’t have adequate experience with it. Also, QE was a novel approach then and its implications were uncertain but clearly the expansion of the Fed’s balance sheet by actively purchasing bonds artificially depressed Treasury yields and caused asset price inflation.
Figure 4: 10-year Treasury Yield and Fed’s Balance Sheet, 2000-2024

Chart Created by CME Group Economics.
Source: Bloomberg Professional (USGG2YR, BCPGCPUS) – Past performance is not indicative of future results
The period from 1980 to 2007 also featured a dramatic leveraging of the US economy as the sum of private and public sector debt levels rose from 125% to 250% of GDP. Post global financial crisis there was no deleveraging. One explanation for the 2009-2021 period of near-zero short-term rates and the necessity of QE was that the only way in which the economy could grow was with extremely low levels of borrowing costs – both short- and long-term. But this period of ultra-low short- and long-term yields depended crucially on inflation remaining low. The post-pandemic resurgence of inflation created a new environment. On one hand, debt levels remain high – so, it’s not clear if the economy can sustain high short-term rates and long-term yields over the long term. However, inflation has been slower to abate than the Fed would like. As such, the Fed is shrinking its balance sheet and has raised rates to over 5%, their highest since 2000.
Figure 5: U.S. Debt
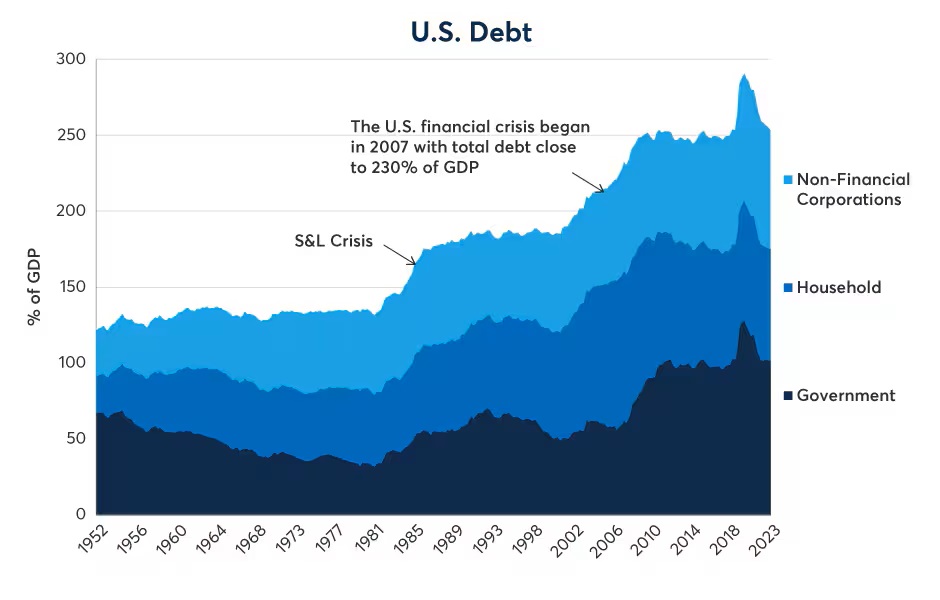
Source: Bank for International Settlements (BIS) – Past performance is not indicative of future results
In 2020 and 2021, nominal GDP growth hit 10% yet there was little expectation that such a rapid pace of expansion would last. Also, the Fed expanded its balance sheet by $4.9 trillion, which prevented 10-year bond yields from rising. Right now, the U.S. is running a large fiscal deficit of about 6% of GDP and it may well grow over time. Meanwhile, the Fed is gradually reducing its balance sheet through a restrained approach, allowing securities to mature without replacement, rather than engaging in active sales of Treasuries and Mortgage-Backed Securities (MBS).
Figure 6: The Fed’s balance sheet expansions were fairly mild comparing to other central banks
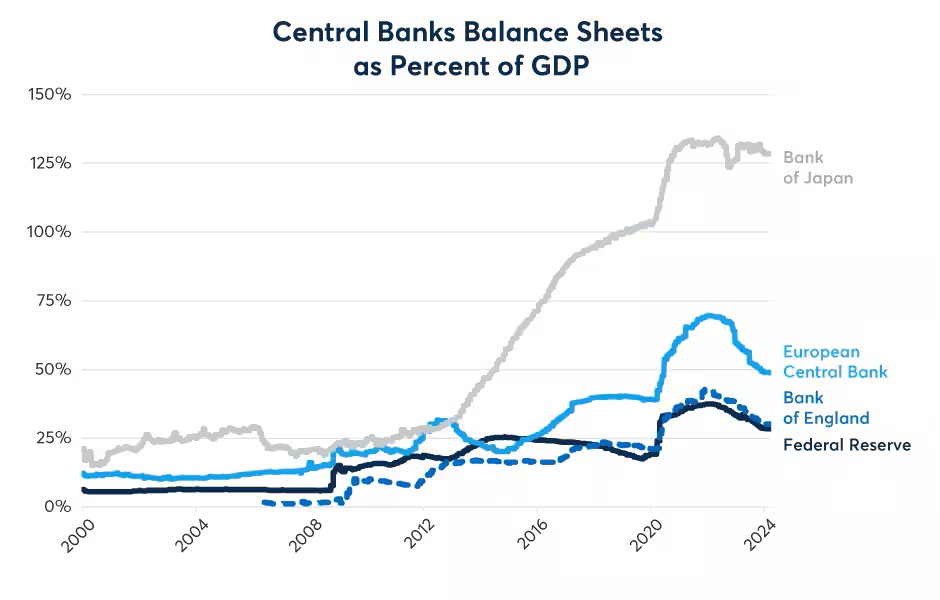
Chart Created by CME Group Economics.
Source: Bloomberg Professional (BSPGCPUS, BSPGCPEU, BSPGCPGB, BSPGCPJP) – Past performance is not indicative of future results
Fed Funds Rate
While the fed funds rate is important for short-term Treasuries, its impact on the 10-year is diminished as when the maturity period extends and future Fed policy becomes increasingly uncertain. In extreme cases, Treasury yields can even move opposite to interest rates changes. For example, when then Fed Chair Alan Greenspan raised short-term rates, long-term yields actually declined, in what he described in 2005 as a “conundrum.” The most popular explanation is that during that period, foreign central banks, especially those in Asia, dramatically increased their purchases of U.S. Treasuries, which led to the decline in Treasury yield.
Figure 7: 10-year Treasury Yield and Fed Funds Rate for the 2004 Conundrum
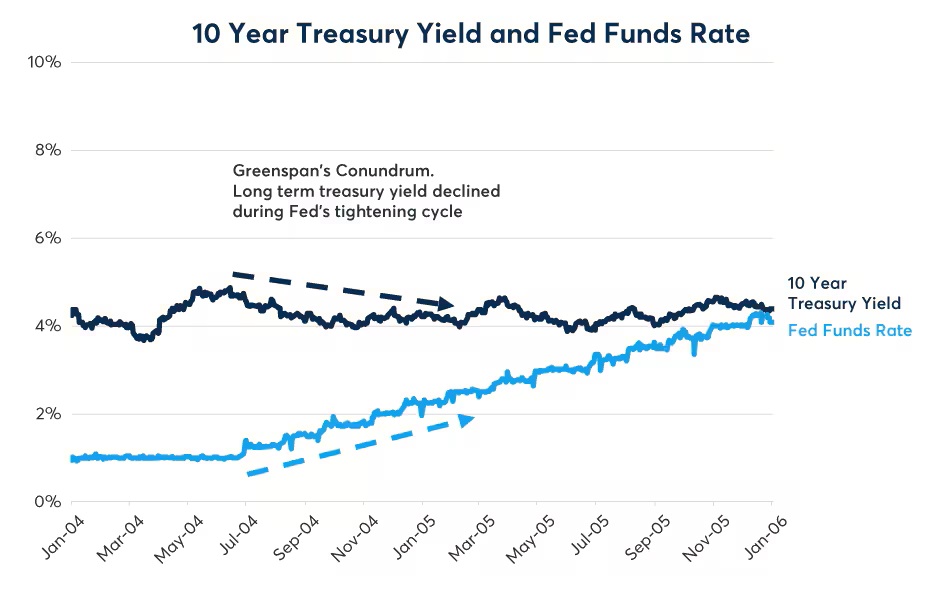
Chart Created by CME Group Economics.
Source: Bloomberg Professional (USGG10YR, FEDL01) – Past performance is not indicative of future results
Bottom Line
Many factors like inflation expectations, economic growth and monetary policy are in play in determining yields for 10-year Treasuries. As interest rates have risen and the inflation rate declined from its 2022 peak of over 9%, the real interest rate has once again entered positive territory. If the Fed remains steadfast in its commitment to maintaining a 2% inflation target, this positive real interest rate environment could persist for an extended period, possibly years. Our analysis of the shift from a negative to a positive real short-term interest rate environment is that the 10-year Treasury yield will respond more or less in line with the growth of personal expenditures, which contain both an inflation and real economy component rather than trade well below personal consumption growth rates as the 10-year did in the negative real rate period of the past decade.
Disclosure: Interactive Brokers
Information posted on IBKR Campus that is provided by third-parties does NOT constitute a recommendation that you should contract for the services of that third party. Third-party participants who contribute to IBKR Campus are independent of Interactive Brokers and Interactive Brokers does not make any representations or warranties concerning the services offered, their past or future performance, or the accuracy of the information provided by the third party. Past performance is no guarantee of future results.
This material is from CME Group and is being posted with its permission. The views expressed in this material are solely those of the author and/or CME Group and Interactive Brokers is not endorsing or recommending any investment or trading discussed in the material. This material is not and should not be construed as an offer to buy or sell any security. It should not be construed as research or investment advice or a recommendation to buy, sell or hold any security or commodity. This material does not and is not intended to take into account the particular financial conditions, investment objectives or requirements of individual customers. Before acting on this material, you should consider whether it is suitable for your particular circumstances and, as necessary, seek professional advice.
Disclosure: Bonds
As with all investments, your capital is at risk.
