


")


Originally posted, 12 Feb 2024 – Where Does All the Meal Go?
By CME Group
Soybean meal is the primary input to animal feed in industrialized agriculture worldwide, used as a valuable source of protein for raising pigs and poultry. Accordingly, soybean production and importation generally supports meat production, though soybean meal is also consumed by humans in the form of tofu, soy milk and imitation meat, in addition to industrial use. Soybean meal is produced through a process called crushing, whereby whole soybeans are processed to produce soybean meal and soybean oil.
Each year, soybeans vie with corn for the title of most widely planted crop in the United States. Brazil is the world’s largest producer of soybeans and leads the world in soybean exports, though China crushes the competition in terms of soybean meal production. Although China is not a major importer of soybean meal, the country is the world’s top importer of soybeans, sustaining the country’s significant crushing industry. China is a major producer but minimal exporter of meal: China’s domestically produced soybean meal is overwhelmingly consumed by the nation’s livestock. Brazil is the leading country of origin among China’s soybean imports.
Top 10 Countries for Soybean Meal, 2022/2023
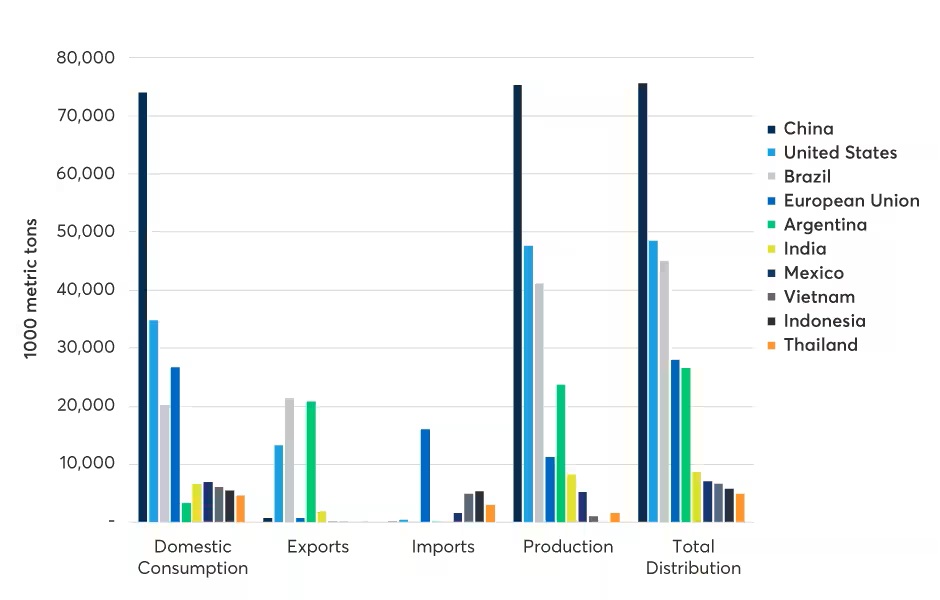
Past performance is not indicative of future results.
Brazil takes the top spot in soybean meal exports, ranking behind China and the United States in soybean meal production in the last full marketing year. Argentina ranks as the second most significant meal exporter globally in the 2022/2023 marketing year and is expected to ascend to the top spot in the present year, exporting nearly all of its domestic production. The European Union is the world’s largest importer of soybean meal, taking in almost 70% more than it produced since the turn of the century. In that time, 98% of domestic disappearance of EU meal was attributable to animal feed. In the late 20th century in the United States, more than half of soybeans used domestically were crushed. Over the last two decades, however, an increasing share of soybeans have been exported, eroding the share crushed domestically. Although in the 2015/2016 and 2021/2022 marketing years, the share of soybeans exported exceeded that crushed domestically, domestic crushing has regained prevalence in the current marketing year.
U.S Domestic Disappearance of Soybeans
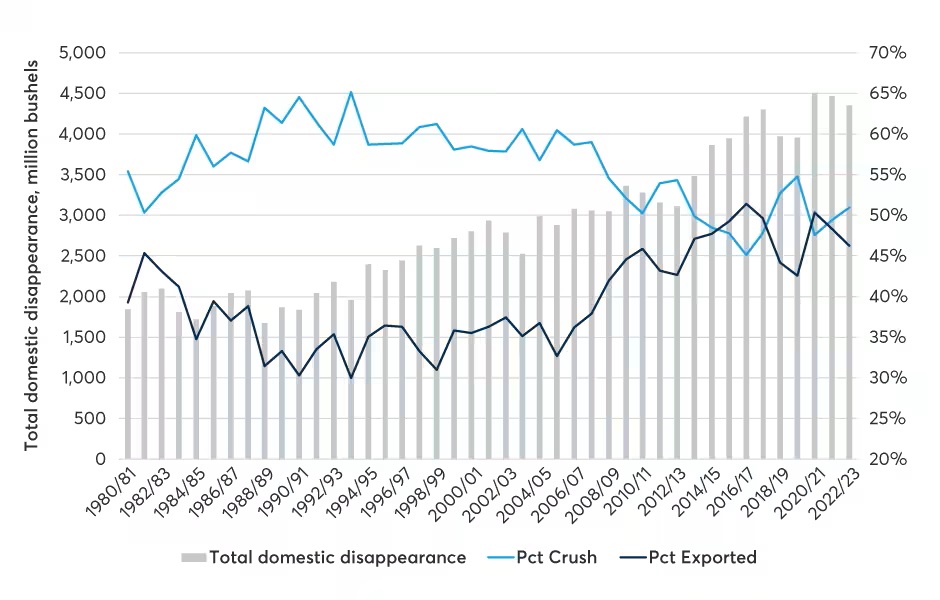
Past performance is not indicative of future results.
The percent of U.S. soybean meal exported varies dramatically by year. The Philippines is the primary recipient of U.S. soybean meal, with imported meal a pillar of the nation’s meat industry. Total domestic disappearance of soybeans in the United States has seen an upward trend in the last three decades, driven by demand for meal, oil and exports.
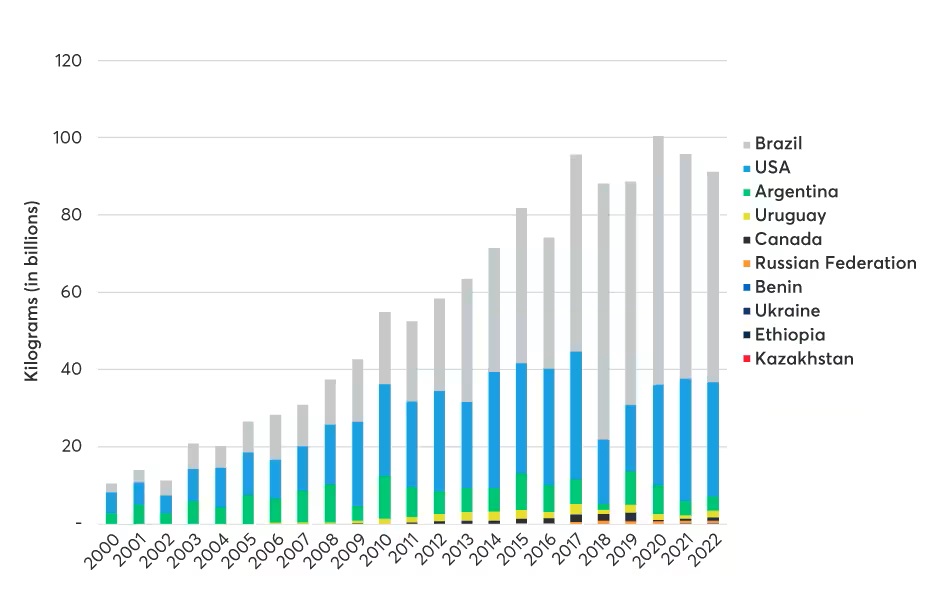
Top 10 Destinations for U.S. Soybean Exports (kg)
Past performance is not indicative of future results.
Although the percentage of U.S. meal exported has been higher in recent years, U.S. soybean meal exports were observed to reach a record high in the marketing year ending September 2023, at 13.2 million tons. Soybean meal produced in the United States overwhelmingly falls under the U.S. Soy Sustainability Assurance Protocol, a verified framework ensuring sustainable sourcing of U.S. soy. Since 1980, soybeans in the United States, on average, use 47% less acres per bushel, 61% less water acre inches per bushel and 45% less BTU per bushel of energy. Greenhouse gas emissions and soil erosion have been reduced by 42% and 35% in terms of pounds of CO2e and tons of soil erosion per bushel, respectively.
Total U.S. Disappearance of Soybean Meal
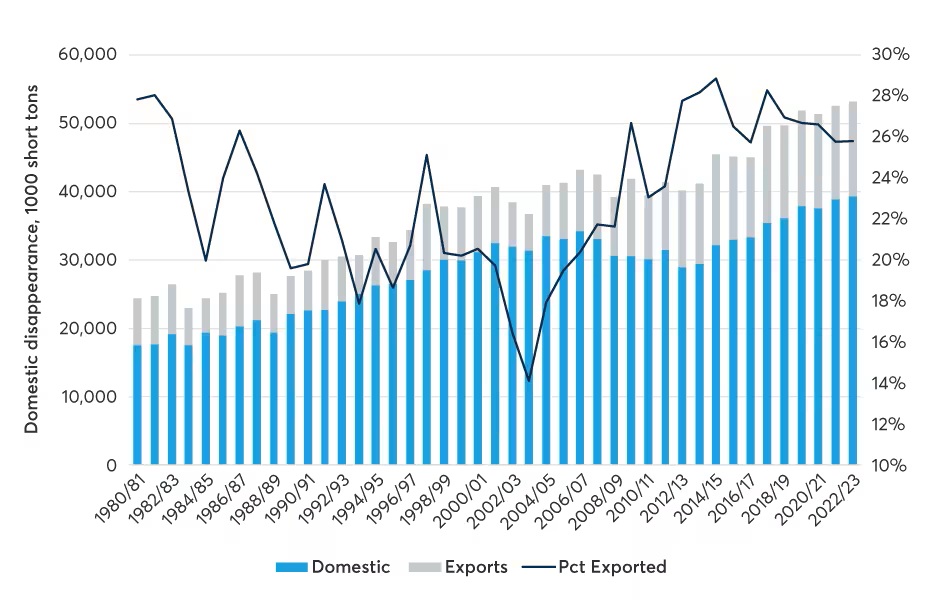
Past performance is not indicative of future results.
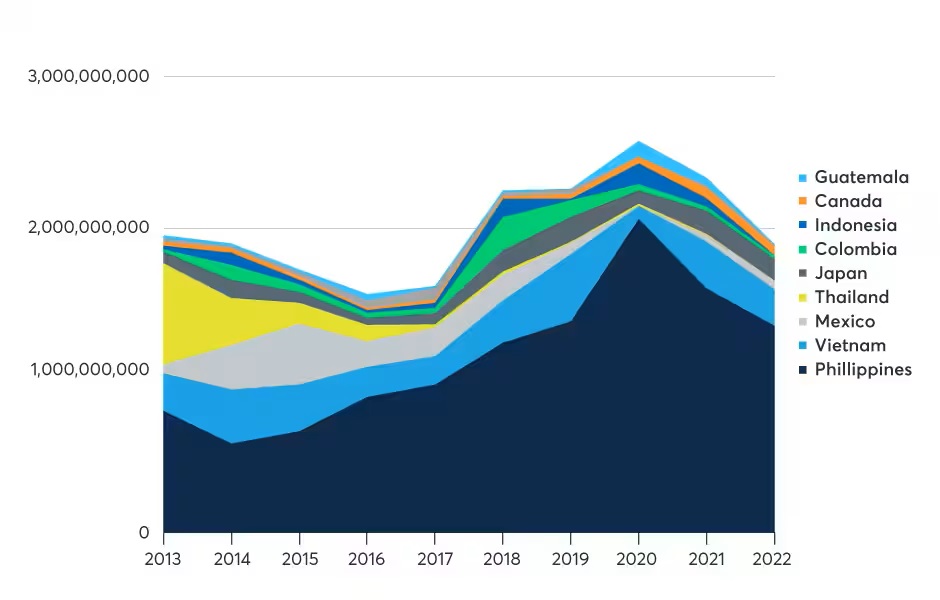
Perhaps the most dynamic force in the soybean complex landscape over the past decade has been the increasing strength of Brazil as a producer and exporter and Brazil’s evolving relationship with China as that country’s imports grow. For the first decade of China’s growth in soybean importation, the United States was the primary country of origin. In the last decade, however, nearly 57% of soybeans imported by China were from Brazil.
Soybean Imports to China by Origin
Past performance is not indicative of future results.
Until the advent of biomass-based diesel and national blending mandates propelling soybean oil to the forefront of the biofuel landscape, soybean crushing was widely accepted to be motivated by demand for soybean meal. Now, with the renewable fuel standard sustaining a powerful policy market for soybean oil, meal and oil share the basis of demand for soybean production and crushing. Since the turn of the century, the share of domestic disappearance of soybean oil to renewable fuels increased from negligible to approaching 50% in the latest crop year. During that time, domestic crushing increased 35%, indicating that new crushing was driven by demand for fuel. This increase in crushing has, as discussed, transformed the soybean meal landscape.
As the soybean complex landscape evolves, CME Group will continue to be the foremost venue for hedging risk or expressing a market view. Learn more at www.cmegroup.com/soybeans.
Disclosure: Interactive Brokers
Information posted on IBKR Campus that is provided by third-parties does NOT constitute a recommendation that you should contract for the services of that third party. Third-party participants who contribute to IBKR Campus are independent of Interactive Brokers and Interactive Brokers does not make any representations or warranties concerning the services offered, their past or future performance, or the accuracy of the information provided by the third party. Past performance is no guarantee of future results.
This material is from CME Group and is being posted with its permission. The views expressed in this material are solely those of the author and/or CME Group and Interactive Brokers is not endorsing or recommending any investment or trading discussed in the material. This material is not and should not be construed as an offer to buy or sell any security. It should not be construed as research or investment advice or a recommendation to buy, sell or hold any security or commodity. This material does not and is not intended to take into account the particular financial conditions, investment objectives or requirements of individual customers. Before acting on this material, you should consider whether it is suitable for your particular circumstances and, as necessary, seek professional advice.
