


")


Study Notes:
When users log in to IBKR Desktop, by default they will see the Positions tab within the Portfolio.
By selecting an instrument, a basic thumbnail chart displays in the panel to the right.
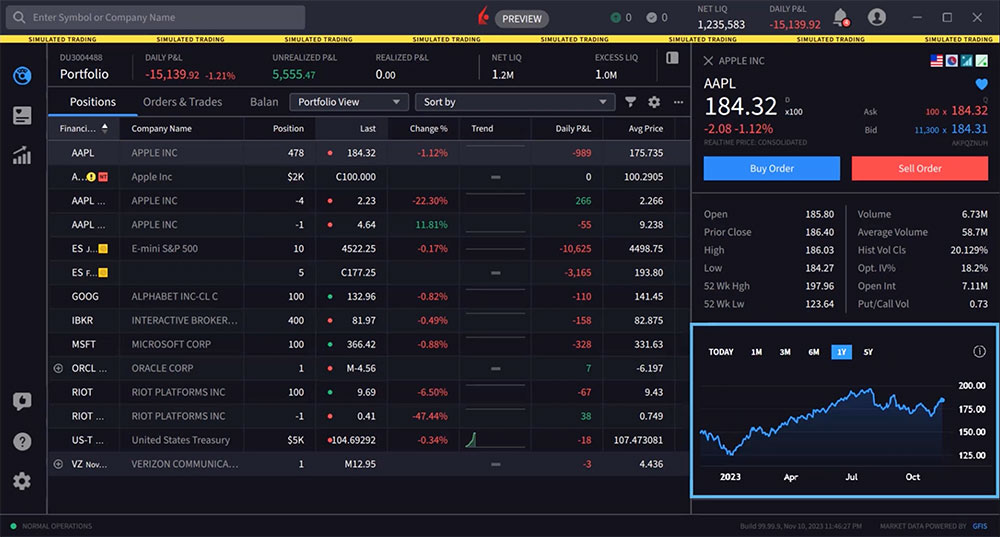
However, users may launch a full-size chart area by either double-clicking on a symbol or by clicking the Quote icon in the left panel.
The Quote Panel is comprised of two panels. By default, the Quote panel opens with the Charts tab selected. Users may also access Option Chains within the Quote panel by clicking on the tab above.
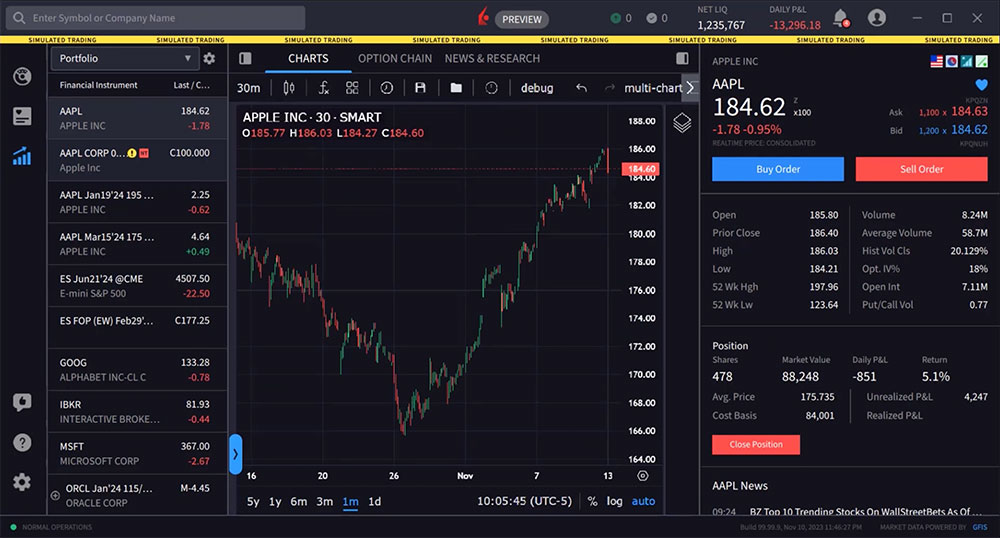
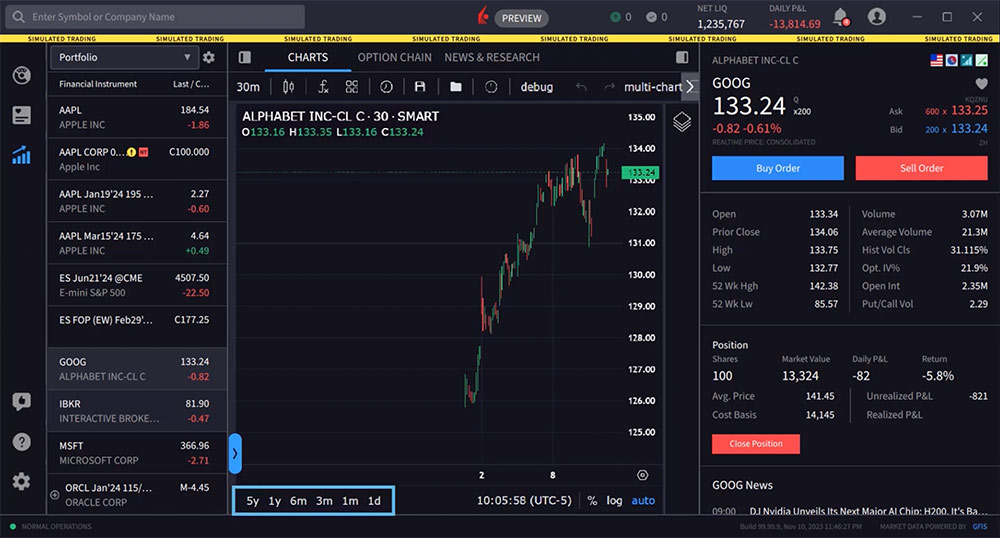
To change the symbol in your chart, select an asset from the Financial Instrument section of the Quote panel.
Changing Time Display
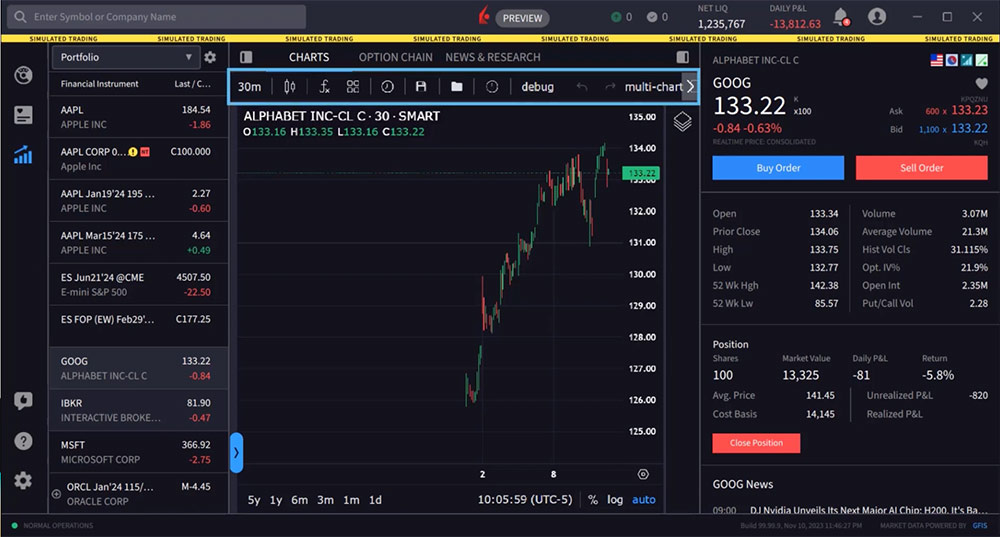
The user can change the time period displayed from the lower left of the chart by clicking on any of the desired time period buttons.
Using the icons along the top of the chart, the user may change the periodicity of the chart display from intraday to daily, weekly etc. For example, let’s choose a symbol and set the display to 1y below the chart. Now, let’s use the icon to the upper left to switch from Day to Week.
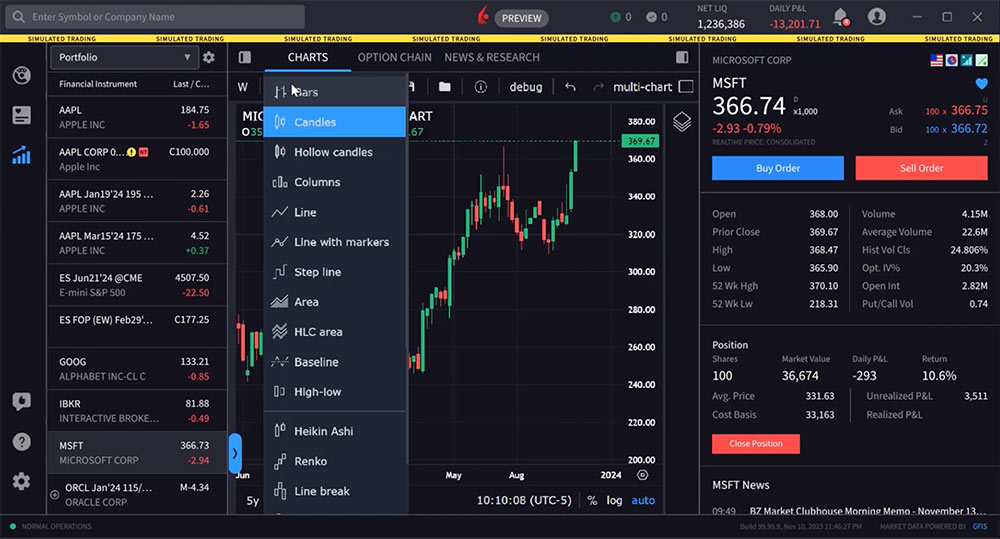
Changing Chart Type
To the right, user may choose from the icon an array of different chart types, from candles, lines, high-low, Heikin Ashi and Point & Figure charts.
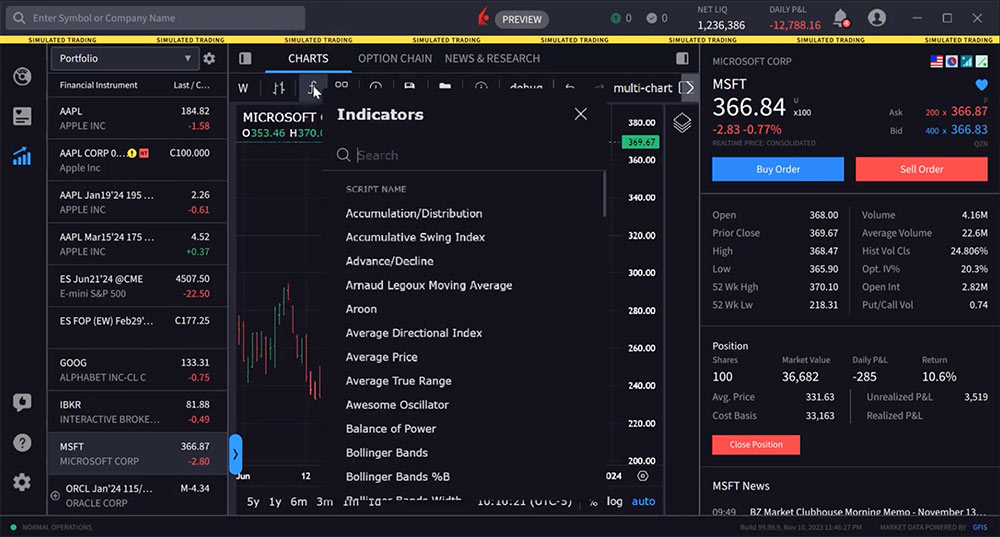
Adding Chart Indicators
Click the indicators icon to display a list of available studies to add to the display. The user may scroll down the list or enter a search term. In this case user is looking for ‘moving average’ and starts to type in the input field. Click the desired indicator to add immediately to the chart. By hovering above the study data beneath the ticker symbol, floating icons appear to the right of the added study and user may hide, see settings or delete the study. In this case user selects settings and can adjust the study inputs to change the settings and click ‘ok’.
Once the user has added a series of indicators to a chart, it may be saved as an indicator template by tapping the four-squares icon and entering a name followed by ‘save’. Saved templates may be accessed by clicking this icon later.
They can also save applied indicators as a template, show or hide Outside Regular Trading Hours data, and save the current chart as a snapshot.
Accessing Drawing Tools
Drawing tools are concealed behind a blue arrow along the lower left edge of the chart. Click that to expand the drawing tools panel. Here the user may click an icon to use a drawing tool. When active, the tool icon is blue. Here, at the top of the icon set, the user can click on or off the chart crosshairs. Use the tools to draw Fibonacci Retracement, Trend Lines and more. Hold your mouse over an icon to see the extended tool menu when applicable. To remove drawings and indicators from the display, the user would right click on a trend or Fibonacci line and select ‘remove’.
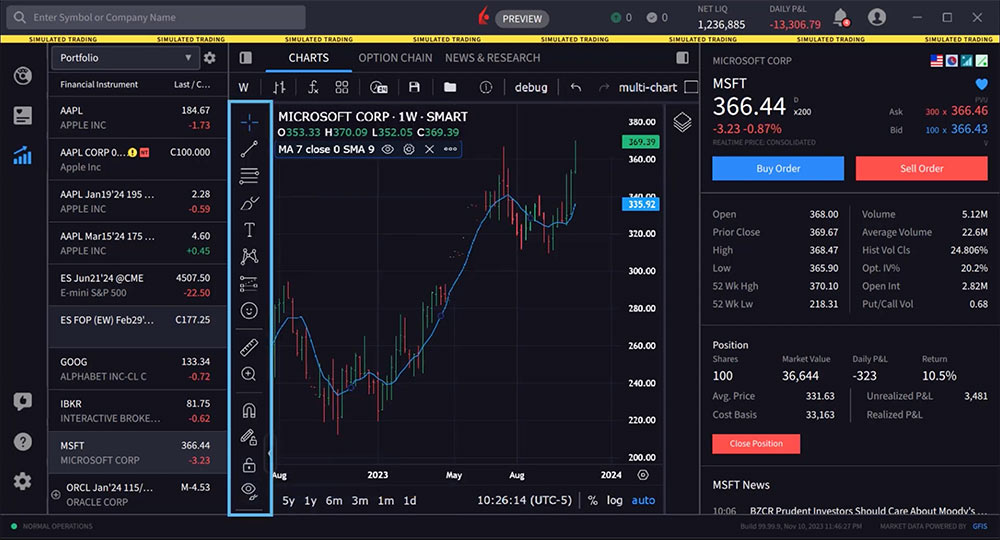
You can increase the size of your chart by hiding the left and right-side panels. Note the Show/Hide panel icons to the upper right and left of the chart. Simply click one or both of these Show/Hide Panel icons to maximize the display.
Note that if the user hides the left panel, which includes the Financial Instruments, they will not be able to change the symbol in the chart. The left side panel must be reopened to select a symbol.
Increasing the Display to Multi-Chart Mode
The user may view multiple charts using multi-chart mode. The multi-chart icon is labelled to the upper right of the display. Click the multi-chart icon to reveal layout choices for up to eight styles.
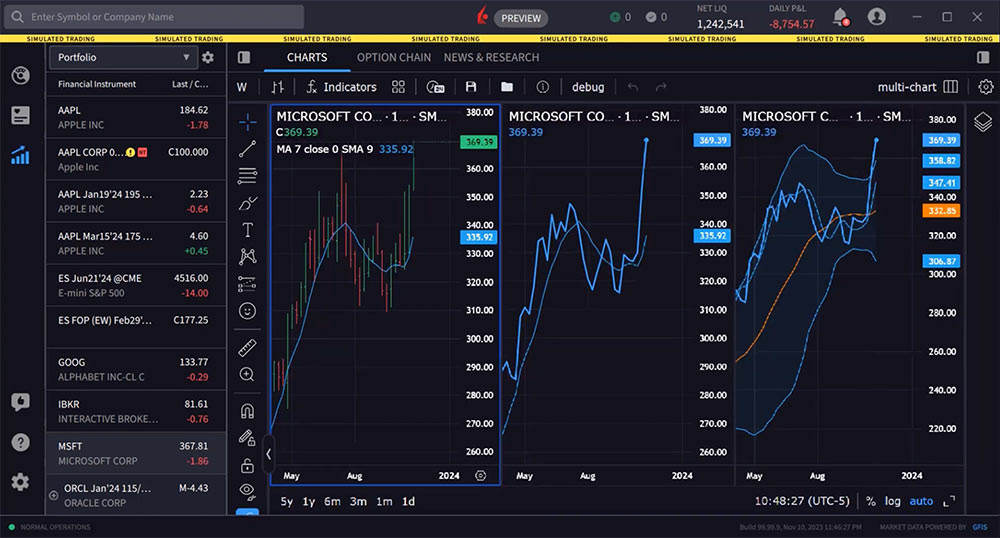
The user may display multiple charts that use the same symbol in each panel by activating Sync in Layout – Symbol. You can also sync up the charts’ interval, crosshair, and time period.
Alternatively, show multiple charts with different symbols by disabling Sync in Layout.
Load different symbols in your charts by selecting a chart and then clicking an asset in the Financial Instrument section.
Chart Customization
Finally, click the gear icon on the top right above the chart for customization options, such as changing colors, labels, background, gridlines and more.