Study Notes:
Open a Chart – Right-click on a symbol in your Watchlist and select Charts>Advanced Charts to launch a new window containing Trading View charts.
By default, a candlestick chart will display accompanied by a volume study in the area below the chart. Also displayed is a dashed red or green line displaying current price. Its color is determined by the current price relative to the close of the prior period. The investor could be looking at a red line, indicating lower on a daily chart, but a green line on a five-minute chart to indicate higher price compared to the closing value of the prior five-minute candle.
Chart Type – The investor can change the display to a bar chart, for example, by clicking on the chart type icon to the upper left. Clicking will reveal a menu of available chart types including bar, candle, hollow candle, line, area, Heikin-Ashi, Point & Figure charts and more. To use the investor should click the desired display type.
A crosshair will also display as the cursor is moved across the chart, allowing the investor to hover over a specific bar and read open/high/low/close values in the Status Line across the top of the screen and volume or additional study values below.
Timeframe – At the top left of the chart is the current time period displayed in the chart, while along the bottom left of the chart is the selected timeframe. The investor can click on one-month or three-month to change the time frame. And adjust the candle period by clicking on the current value in the upper left to reveal a dropdown containing additional time periods. They can click to choose intraday or a longer view. Note: The investor may also enable/disable real-time hours by clicking this icon in the top row.
Chart Settings – The investor can use the Chart Settings configuration icon to the upper right of the chart window to adjust color and other display features. Note the Symbol icon is highlighted upon opening and the default colors are displayed for Body, Borders, Wick and Last Price Line. The investor can click the color to access the color palette and change as required. Next, they click the Status Line setting to reveal those items contained within it across the top of the chart. For example, here the investor can elect to turn on/off what data is displayed in both the main chart area as well as in the Study area below.
Object Tree – Below the Configuration in the upper right of the window is a diamond-shaped icon for the Object Tree. The investor can click the icon to reveal the Object Tree, which then displays all items shown on the chart and enables the user to show or hide the object or delete it. As more indicators or studies are added to each chart, they populate the Object Tree. Click the eye icon to temporarily hide the study from the display or use the X icon to remove from both display and Object Tree.
Add Study/Indicator – To review and select all technical indicators the investor should click on the fx Indicators button in the horizontal toolbar at the top of the chart. Here, the investor can scroll down the list in alphabetical order or use the search bar to enter a term to narrow a search.
Studies can be added/ removed or hidden to enable focus on price action. To remove the volume study, the investor should right-click to open the dialogue box and click on Remove. Studies can be hidden with a right-click and selecting on Hide. Notice that when a study is hidden, it appears in the upper left corner below the ticker symbol. To reinstate, click on the ellipse and select Show.
Change Symbol – To change the symbol displayed in the chart, the investor can use the input field to the upper left of the window. They should enter the symbol or select from the saved symbols.
Drawing Toolbar – Investors can add trendlines to any chart. They can access the Drawing toolbar to the left of the chart. This toolbar can be hidden and revealed by using the Hide/Show Drawing Toolbar arrow. When revealed, notice when hovering to the right of a drawing icon, the name of the tool and an expansion arrow is revealed. This [second from top] icon is the trendline icon. When expanded the investor will see an array of different types of trend lines. For this example they will click the first for basic trend line to illustrate how to add a line to this chart.
The investor should left click on the chart to pin the start of the desired trend line. Then they should left click again on the end point to complete the line. Each end of the trend line displays a circle. The investor may left click again on either circle, but this time keep the mouse depressed, and adjust the line to lengthen or shorten it. To remove a trendline, click on the trash can in the Drawing Tools.
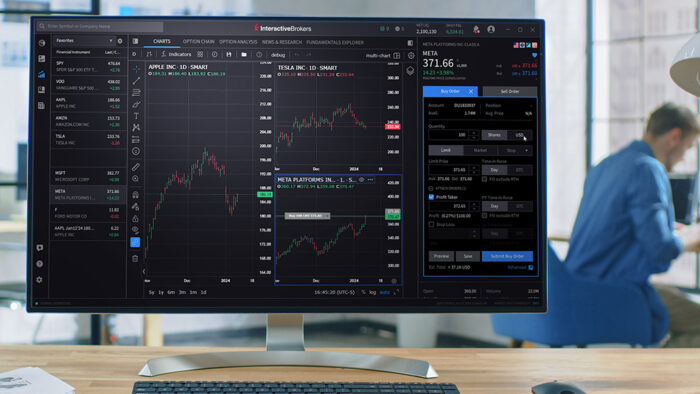
Multiple Charts in Single Window – Using the Custom Layout feature investors can create an entire page containing multiple charts using different symbols and timeframes. At the bottom of the Mosaic screen they can click on the ‘+’ sign. The investor should type in a new name for their charting page and click Create a Custom Layout. The new page will appear as a tab at the bottom of the Mosaic window. In the upper left of the page the investor clicks New Window and then Chart and Advanced Chart. The investor can repeat in order to add as many charts as they would like to display. I will add four to demonstrate, each time starting from the New Window button. At this stage it doesn’t matter what symbol populates.
When customizing the layout, the investor is in Design Mode, which means that their layout is unlocked. The investor can tell this by the vibrant green padlock in the upper right. Currently it is unlocked, which means they can edit and move things around the page. The investor can resize the charts to enlarge them by hovering the mouse above the edge of a panel and clicking right to drag into the shape they want. For this example, the investor will do this for each chart to completely cover the workspace. When finished they have four identical charts. Click the padlock to lock the display in place.
Notice that since the tiles are currently linked by the Group Windows function, should the investor change one symbol, all windows will change. The investor can click each Group Windows chain and select No Group to make them all independent. Now the investor may assign each tile with a different symbol. And the investor can change timeframe, chart type and independently add different studies to each chart. The Custom Layout automatically saves and will automatically open when next logging in to TWS.


